系统:Ubuntu 14
Elasticsearch version: 5.4.0
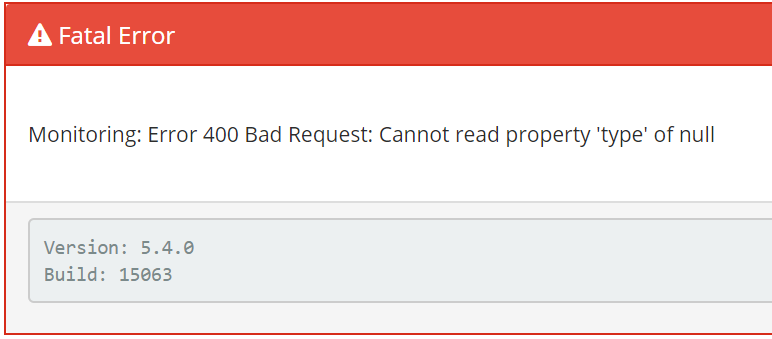
加入一个新的节点到ES集群,导致Kibana Monitor模块均出现错误,其他模块正常。请问一下有解决办法吗?
I have just added new nodes to an Elasticsearch cluster. I had Kibana and X-Pack installed and could see metrics via the monitoring dashboard. After the scaling, all works as before, apart from the monitoring/metrics page, where I get an error message:
Fatal Error
Monitoring: Error 400 Bad Request: Cannot read property 'type' of null
Version: 5.4.0
Build: 15063


1 个回复
medcl - 今晚打老虎。
赞同来自: