

关于filebeat 的monitor指标的一些疑问:Total,Emitted,Acknowleged和Queued
Beats | 作者 zahgboat | 发布于2018年10月29日 | 阅读数:4382
服务器运行环境
>CentOS Linux release 7.2 (Final)
软件版本:
>filebeat 6.3.2
>logstash 6.3.2
>elastic search 6.3.x
问题发生的上下文:
使用ES Stack记录业务关键日志,尝试优化写入性能,对filebeat的monitor面板上展示的一些指标的含义不是很明确
大神们好,小弟刚入门ES stack, 尝试优化写入性能时发现有一些指标看不大懂,不太好做优化决策:
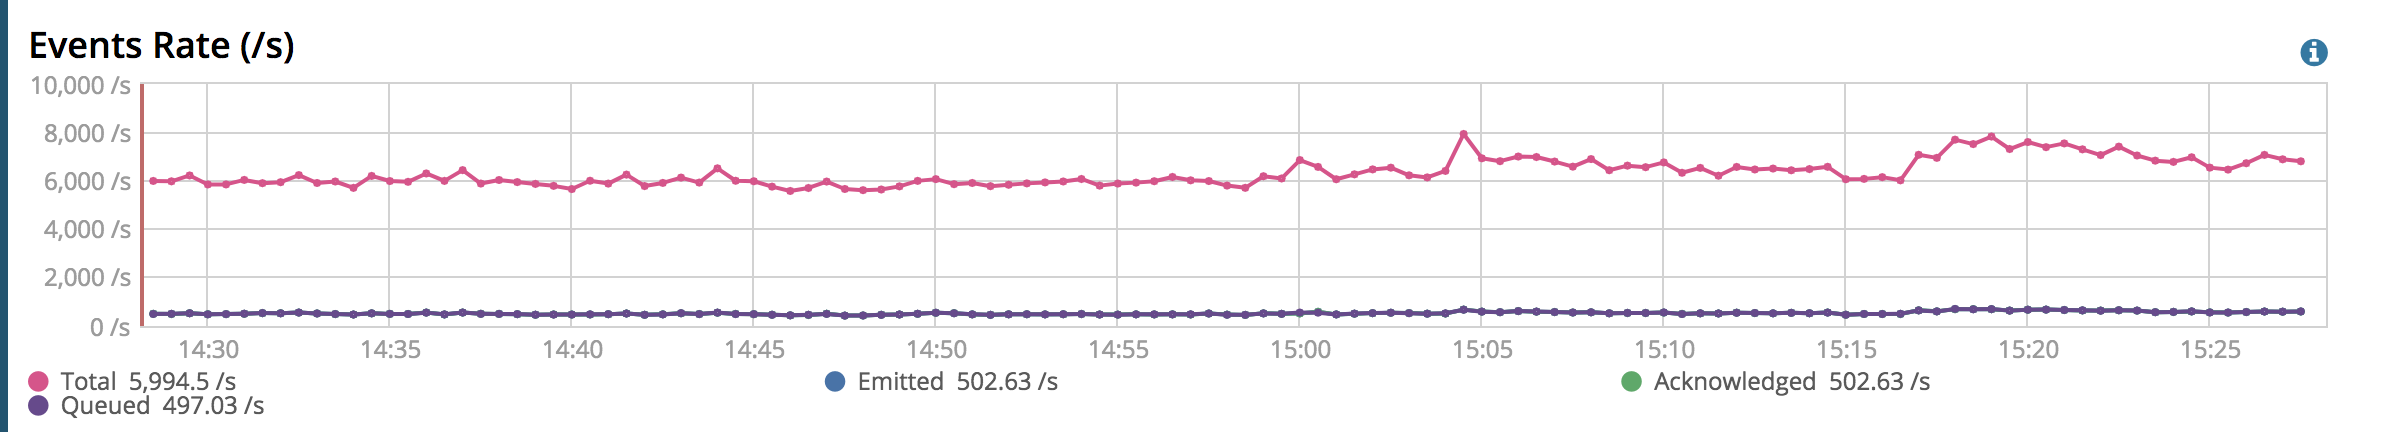
如上,是filebeat通过xpack的monitor上报的指标,在kibana上展示; 小弟不太懂的有如下几点:
1. Total是不是指的应该被发送出去的全部event?
2. Total/Emitted/Acknowledge和Queued之间有什么数量关系?
3. 上述这四个指标正常的大小关系应该是什么样的? Total的数量基本保持在Emitted的10倍以上,是否正常?
小弟看过截图所示右上角的含义阐述,还有ES的官方文档,但是还是不太懂,所以特来请教社区里的各位大神!
>CentOS Linux release 7.2 (Final)
软件版本:
>filebeat 6.3.2
>logstash 6.3.2
>elastic search 6.3.x
问题发生的上下文:
使用ES Stack记录业务关键日志,尝试优化写入性能,对filebeat的monitor面板上展示的一些指标的含义不是很明确
大神们好,小弟刚入门ES stack, 尝试优化写入性能时发现有一些指标看不大懂,不太好做优化决策:
如上,是filebeat通过xpack的monitor上报的指标,在kibana上展示; 小弟不太懂的有如下几点:
1. Total是不是指的应该被发送出去的全部event?
2. Total/Emitted/Acknowledge和Queued之间有什么数量关系?
3. 上述这四个指标正常的大小关系应该是什么样的? Total的数量基本保持在Emitted的10倍以上,是否正常?
小弟看过截图所示右上角的含义阐述,还有ES的官方文档,但是还是不太懂,所以特来请教社区里的各位大神!

1 个回复
rochy - rochy_he
赞同来自:
Emitted: 'Events processed by the output (including retries)'
Acknowledged:'Events acknowledged by the output (includes events dropped by the output)'
Queued:'Events added to the event pipeline queue'