下边是完整日志:
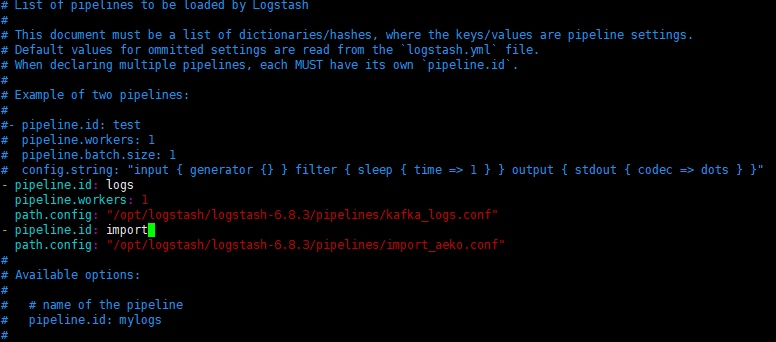
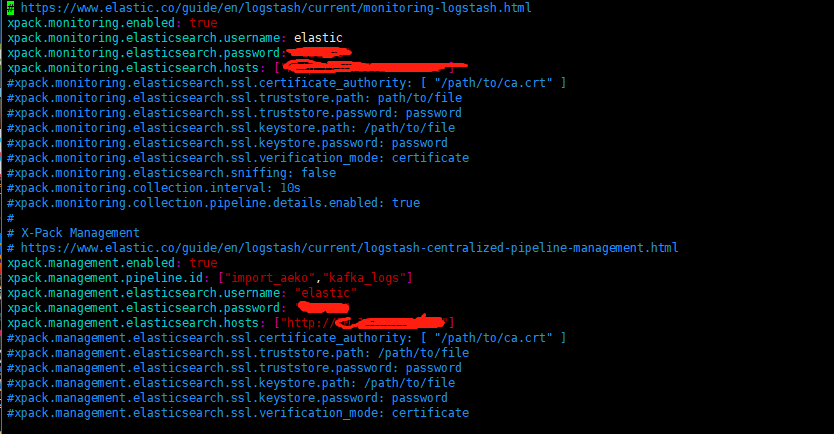
附件是logstash.yml和pipeline.yml的截图,求各位大佬帮忙看下
Sending Logstash logs to /opt/logstash/logstash-6.8.3/logs which is now configured via log4j2.properties
[2019-09-27T10:34:11,863][INFO ][logstash.configmanagement.bootstrapcheck] Using Elasticsearch as config store {:pipeline_id=>["import_aeko", "kafka_logs"], :poll_interval=>"5000000000ns"}
[2019-09-27T10:34:13,247][INFO ][logstash.configmanagement.elasticsearchsource] Configuration Management License OK
[2019-09-27T10:34:13,741][INFO ][logstash.runner ] Starting Logstash {"logstash.version"=>"6.8.3"}
[2019-09-27T10:34:14,667][INFO ][logstash.monitoring.internalpipelinesource] Monitoring License OK
[2019-09-27T10:34:14,668][INFO ][logstash.monitoring.internalpipelinesource] Validated license for monitoring. Enabling monitoring pipeline.
[2019-09-27T10:34:14,735][INFO ][logstash.configmanagement.elasticsearchsource] Elasticsearch pool URLs updated {:changes=>{:removed=>[], :added=>[http://elastic:xxxxxx@10.139.20.7:9200/]}}
[2019-09-27T10:34:14,742][WARN ][logstash.configmanagement.elasticsearchsource] Restored connection to ES instance {:url=>"http://elastic:xxxxxx@10.139.20.7:9200/"}
[2019-09-27T10:34:14,749][INFO ][logstash.configmanagement.elasticsearchsource] ES Output version determined {:es_version=>6}
[2019-09-27T10:34:14,749][WARN ][logstash.configmanagement.elasticsearchsource] Detected a 6.x and above cluster: the `type` event field won't be used to determine the document _type {:es_version=>6}
[2019-09-27T10:34:14,798][ERROR][logstash.config.sourceloader] No configuration found in the configured sources.
[2019-09-27T10:34:20,799][WARN ][logstash.outputs.elasticsearch] You are using a deprecated config setting "document_type" set in elasticsearch. Deprecated settings will continue to work, but are scheduled for removal from logstash in the future. Document types are being deprecated in Elasticsearch 6.0, and removed entirely in 7.0. You should avoid this feature If you have any questions about this, please visit the #logstash channel on freenode irc. {:name=>"document_type", :plugin=><LogStash::Outputs::ElasticSearch bulk_path=>"/_xpack/monitoring/_bulk?system_id=logstash&system_api_version=6&interval=1s", password=><password>, hosts=>[http://10.139.20.7:9200], sniffing=>false, manage_template=>false, id=>"70d647712040e466f71de83c261e936dd023571d2749fb7b7b314ce0fa494d71", user=>"elastic", document_type=>"%{[@metadata][document_type]}", enable_metric=>true, codec=><LogStash::Codecs::Plain id=>"plain_e653b878-b4bc-48c0-8571-57bbed6b2c2e", enable_metric=>true, charset=>"UTF-8">, workers=>1, template_name=>"logstash", template_overwrite=>false, doc_as_upsert=>false, script_type=>"inline", script_lang=>"painless", script_var_name=>"event", scripted_upsert=>false, retry_initial_interval=>2, retry_max_interval=>64, retry_on_conflict=>1, ilm_enabled=>false, ilm_rollover_alias=>"logstash", ilm_pattern=>"{now/d}-000001", ilm_policy=>"logstash-policy", action=>"index", ssl_certificate_verification=>true, sniffing_delay=>5, timeout=>60, pool_max=>1000, pool_max_per_route=>100, resurrect_delay=>5, validate_after_inactivity=>10000, http_compression=>false>}
[2019-09-27T10:34:20,846][INFO ][logstash.pipeline ] Starting pipeline {:pipeline_id=>".monitoring-logstash", "pipeline.workers"=>1, "pipeline.batch.size"=>2, "pipeline.batch.delay"=>50}
[2019-09-27T10:34:21,012][INFO ][logstash.outputs.elasticsearch] Elasticsearch pool URLs updated {:changes=>{:removed=>[], :added=>[http://elastic:xxxxxx@10.139.20.7:9200/]}}
[2019-09-27T10:34:21,054][WARN ][logstash.outputs.elasticsearch] Restored connection to ES instance {:url=>"http://elastic:xxxxxx@10.139.20.7:9200/"}
[2019-09-27T10:34:21,062][INFO ][logstash.outputs.elasticsearch] ES Output version determined {:es_version=>6}
[2019-09-27T10:34:21,062][WARN ][logstash.outputs.elasticsearch] Detected a 6.x and above cluster: the `type` event field won't be used to determine the document _type {:es_version=>6}
[2019-09-27T10:34:21,078][INFO ][logstash.outputs.elasticsearch] New Elasticsearch output {:class=>"LogStash::Outputs::ElasticSearch", :hosts=>["http://10.139.20.7:9200"]}
[2019-09-27T10:34:21,176][INFO ][logstash.pipeline ] Pipeline started successfully {:pipeline_id=>".monitoring-logstash", :thread=>"#<Thread:0x59a89761 run>"}
[2019-09-27T10:34:21,221][INFO ][logstash.agent ] Pipelines running {:count=>1, :running_pipelines=>[:".monitoring-logstash"], :non_running_pipelines=>[]}
[2019-09-27T10:34:21,514][INFO ][logstash.agent ] Successfully started Logstash API endpoint {:port=>9600}
[2019-09-27T10:34:31,283][ERROR][logstash.inputs.metrics ] Failed to create monitoring event {:message=>"For path: events. Map keys: [:reloads, :pipelines]", :error=>"LogStash::Instrument::MetricStore::MetricNotFound"}
[2019-09-27T10:34:41,301][ERROR][logstash.inputs.metrics ] Failed to create monitoring event {:message=>"For path: events. Map keys: [:reloads, :pipelines]", :error=>"LogStash::Instrument::MetricStore::MetricNotFound"}
[2019-09-27T10:34:51,309][ERROR][logstash.inputs.metrics ] Failed to create monitoring event {:message=>"For path: events. Map keys: [:reloads, :pipelines]", :error=>"LogStash::Instrument::MetricStore::MetricNotFound"}


0 个回复