悟空,拿我的打狗棒来
elasicsearch

elasicsearch

multi_match+term的组合查询,能否提高term匹配的得分权重,让其排序在前面

Elasticsearchlaoyang360 回复了问题 • 3 人关注 • 2 个回复 • 3784 次浏览 • 2024-01-26 20:59 • 来自相关话题

求助,ES对查询结果进行后置处理

Elasticsearchlaoyang360 回复了问题 • 3 人关注 • 2 个回复 • 2335 次浏览 • 2024-01-07 22:22 • 来自相关话题

span_containing和span_with查询到底是什么意思?两者什么区别?

ElasticsearchCharele 回复了问题 • 5 人关注 • 3 个回复 • 2966 次浏览 • 2023-09-08 16:14 • 来自相关话题

es局部更新文档字段

Elasticsearchduanxiaobiao 回复了问题 • 2 人关注 • 1 个回复 • 4861 次浏览 • 2023-04-02 15:39 • 来自相关话题

ES 使用Join父子文档的方式能否一次查询,同时返回父文档和子文档的结果

Elasticsearchlaoyang360 回复了问题 • 2 人关注 • 1 个回复 • 5039 次浏览 • 2023-02-08 10:31 • 来自相关话题

keyword类型的数字的大于小于查询

Elasticsearchlaoyang360 回复了问题 • 3 人关注 • 3 个回复 • 1889 次浏览 • 2022-05-29 15:02 • 来自相关话题

elasticsearch疯狂的读磁盘是怎么回事?

Elasticsearchpony_maggie 回复了问题 • 7 人关注 • 6 个回复 • 2721 次浏览 • 2020-12-03 12:35 • 来自相关话题

索引某个shard无法恢复的问题

Elasticsearchshwtz 回复了问题 • 15 人关注 • 5 个回复 • 22710 次浏览 • 2020-08-31 11:20 • 来自相关话题

elasticsearch-6.2.2启动后CURL请求后报 master_not_discovered_exception错误

Elasticsearchopewhgori 回复了问题 • 4 人关注 • 3 个回复 • 17656 次浏览 • 2020-08-16 11:45 • 来自相关话题

删除index下type的mapping

Elasticsearchdadaball 回复了问题 • 2 人关注 • 1 个回复 • 2209 次浏览 • 2020-05-26 16:16 • 来自相关话题

关于数字.字母的匹配问题

Elasticsearchsxwinter 回复了问题 • 5 人关注 • 6 个回复 • 4431 次浏览 • 2020-03-07 14:31 • 来自相关话题

Elasticsearch安装报错:max size virtual memory is too low, increase to [unlimited]

Elasticsearchdamon10244201 回复了问题 • 3 人关注 • 2 个回复 • 8754 次浏览 • 2020-03-04 17:56 • 来自相关话题

long类型的时间字段date_histogram,extended_bounds,min无效?

Elasticsearchyetao 回复了问题 • 5 人关注 • 2 个回复 • 7407 次浏览 • 2020-01-01 14:38 • 来自相关话题

修改Lucene源码,重新打包,替换elasticsearch中原有的Lucene-core.jar包,出现问题

ElasticsearchKalasearch 回复了问题 • 2 人关注 • 1 个回复 • 6907 次浏览 • 2019-12-29 04:06 • 来自相关话题

elasticsearch索引生命周期管理

回复

Elasticsearchshaoyuwu 发起了问题 • 1 人关注 • 0 个回复 • 1917 次浏览 • 2019-12-24 20:48 • 来自相关话题

条新动态, 点击查看
1.不同的分词会产生不同的分词结果,max_word产生的词位置有重叠;smart不会有位置重叠;
2.查询条件加引号,查询处理的时候,会将引号内的查询关键字作为一个整体,重写为 phrase 查询;

索引:中国人民银行 -> 中国人民银行 中国人... 显示全部 »
1.不同的分词会产生不同的分词结果,max_word产生的词位置有重叠;smart不会有位置重叠;
2.查询条件加引号,查询处理的时候,会将引号内的查询关键字作为一个整体,重写为 phrase 查询;

索引:中国人民银行 -> 中国人民银行 中国人民 中国人 中国 国人人民银行 人民 银行 银 行
查询:"\"中国人 中国\""-> "中国人 中国 国人 中国" ,是一个Phrase查询。

 
关键点在于查询展开之后,附加了一个“中国”,这个中国是带有位置属性的(phrase),而在索引里面,是没有两个“中国”的,即需要保证先出现一个“中国人”,然后“中国”,再出现一个“国人”,再出现一个“中国”,所以命中不了,有 4 个term要出现,且满足一个大概的位置,当然,可以通过 slop 设置位置的跳跃。
 
你要是把索引数据改成:“中国人民银行 中国”,就能查出来。
  
 
kennywu76

kennywu76 回答了问题 • 2017-11-30 16:50 • 3 个回复 不感兴趣

kibana怎样配置向多个ES请求

赞同来自:

Kibana从5.5开始已经支持cross cluster search。 所以要是用的比较高的版本,配置一下就可以了,参考:https://www.elastic.co/guide/en/kibana/5.5/management-cross-cluster... 显示全部 »
Kibana从5.5开始已经支持cross cluster search。 所以要是用的比较高的版本,配置一下就可以了,参考:https://www.elastic.co/guide/en/kibana/5.5/management-cross-cluster-search.html
匿名用户

kennywu76 回答了问题 • 2017-12-18 11:06 • 3 个回复 不感兴趣

倒排索引 数字和日期类型的问题

赞同来自:

早期ES/Lucene版本是将数值转换成字符串形式,利用倒排表做查找的。 为了解决离散的数值多带来的查找性能问题,Lucene在编排倒排表的时候,比较巧妙的引入了一些特殊的Term,比如"
50x75=[doc40,doc41,doc53,doc78... 显示全部 »
早期ES/Lucene版本是将数值转换成字符串形式,利用倒排表做查找的。 为了解决离散的数值多带来的查找性能问题,Lucene在编排倒排表的时候,比较巧妙的引入了一些特殊的Term,比如"
50x75=[doc40,doc41,doc53,doc78,doc99,...]", 表示50-75这个范围的数值包含在后面哪些文档列表里。由此“
50 OR 51 OR 52 ... OR 100”这样的范围查找,被优化成类似“50x75 OR 76x99 OR 100"这样的形式。 对于该算法的详细解释参考:  https://blog.parse.ly/post/1691/lucene/  
 
从ES5.0版本(Lucene 6.0)开始,对于数值型字段,改用了k-d tree这种数据结构编码。 改用这种数据结构以后,数值型数据的索引以及范围查找效率比之前用倒排编码的方式提高很多。参考:  https://www.elastic.co/blog/lucene-points-6.0
 
strglee

strglee 回答了问题 • 2017-12-22 19:26 • 3 个回复 不感兴趣

elasticsearch删除字段

赞同来自:

删除单条
POST /type/1/_update
{
"script" : "ctx._source.remove(\"name\")"
}
批量删除
[code]POST /type/... 显示全部 »
删除单条
POST /type/1/_update
{
"script" : "ctx._source.remove(\"name\")"
}
批量删除
[code]POST /type/_update_by_query
{
"script" : "ctx._source.remove(\"name\")",
"query": {
"bool": {
"must":
}
}
}
删除mapping 里面的字段,目前还不支持,只能建立新的mapping了
 
kennywu76

kennywu76 回答了问题 • 2018-03-23 12:26 • 3 个回复 不感兴趣

使用elasticsearch 做排重存储使用的可行性

赞同来自:

功能上可行,主要还是需要测试一下性能。 因为op=create这种方式写入文档,遇到重复的id会抛异常,从而阻止写入。 所以当有大量重复文档的时候,catch大量的异常产生的性能损耗就不能够忽视。 
 
20w每秒的写入量不算小,自己剋模拟不同量级的id重复情... 显示全部 »
功能上可行,主要还是需要测试一下性能。 因为op=create这种方式写入文档,遇到重复的id会抛异常,从而阻止写入。 所以当有大量重复文档的时候,catch大量的异常产生的性能损耗就不能够忽视。 
 
20w每秒的写入量不算小,自己剋模拟不同量级的id重复情况,测试一下写入吞吐量,据此规划硬件资源。
kennywu76

kennywu76 回答了问题 • 2018-04-18 16:15 • 5 个回复 不感兴趣

索引某个shard无法恢复的问题

赞同来自:

这种情况一般出现在有结点短暂离开集群,然后马上重新加入,并且有线程正在对某个shard做bulk或者scroll等长时间的写入操作。等结点重新加入集群的时候,由于shard lock没有释放,master无法allocate这个shard。  通常/_clus... 显示全部 »
这种情况一般出现在有结点短暂离开集群,然后马上重新加入,并且有线程正在对某个shard做bulk或者scroll等长时间的写入操作。等结点重新加入集群的时候,由于shard lock没有释放,master无法allocate这个shard。  通常/_cluster/reroute?retry_failed=true可以解决问题,如果按照你说的依然无法解决,可能还有其他原因导致锁住该shard的线程长时间操作该shard无法释放锁(长时间GC?)。 
 
如果retry_failed无法解决问题,可以尝试一下allocate_stale_primary,前提是需要知道这个shard的primary在哪个结点上。实在解决不了,又不想丢数据,还可以重启一下该结点,内存锁应该可以释放。
kennywu76

kennywu76 回答了问题 • 2018-05-12 10:57 • 4 个回复 不感兴趣

discovery.zen.ping_timeout 参数作用的疑惑和探究

赞同来自:

@yayg2008 补充得是对的。 我最初的分析里面有一些不正确的地方。  discovery.zen.ping_timeout主要是控制master选举过程中,发现其他node存活的超时设置,主要影响选举的耗时,  判断结点是否脱离是discovery.ze... 显示全部 »
@yayg2008 补充得是对的。 我最初的分析里面有一些不正确的地方。  discovery.zen.ping_timeout主要是控制master选举过程中,发现其他node存活的超时设置,主要影响选举的耗时,  判断结点是否脱离是discovery.zen.fd.ping_timeout这个参数。
 
我们生产环境discovery.zen.ping_timeout用的默认的3s, 而discovery.zen.fd相关的几个参数设置如下:

ping_interval: 10s  (默认1s)
ping_timeout: 60s   (默认30)
ping_retries: 3   (等于默认值)

这些参数在我们的环境长期运行后验证基本是比较理想的。 只有负载最重的日志集群,在夜间做force merge的时候,因为某些shard过大(300 - 400GB), 大量的IO操作因为机器load过高,偶尔出现结点被误判脱离,然后马上又加回的现象。 虽然继续增大上面的几个参数可以减少误判的机会,但是如果真的有结点故障,将其剔除掉的周期又太长。 所以我们还是通过增加shard数量,限制shard的size来缓解forcemerge带来的压力,降低高负载结点被误判脱离的几率。 
 
kennywu76

kennywu76 回答了问题 • 2018-06-08 11:33 • 6 个回复 不感兴趣

ES集群如何进行挨个重启?

赞同来自:

我来科普一下吧。
 
当cluster.routing.allocation.enable设置为"none"的时候,不会allocate任何UNASSIGNED状态的shard,但是有一个特例:

本地的因为重启而变成UNASSIGNED... 显示全部 »
我来科普一下吧。
 
当cluster.routing.allocation.enable设置为"none"的时候,不会allocate任何UNASSIGNED状态的shard,但是有一个特例:

本地的因为重启而变成UNASSIGNED状态的primary  shard不受这个参数约束

 
怎么理解这个规则呢?举个例子吧。
 
假设集群索引都有设置复制片,然后重启了某一个结点,该结点上的shard会经历下面这个过程:

replica变成UNASSIGNED
primary在其他结点上对应的replica被推举为primary,而本地的这些primary变成replica,并且状态变成UNASSIGNED
由于cluster.routing.allocation.enable设置为none, 这些replica不会再其他结点上复制恢复,保持在UNASSIGNED状态
因此集群状态应该是yellow,意味着所有索引的primary都存在可用,只是部分复制片因为上述参数设置的原因,没有立即进行恢复。
重启的结点加入集群,通过master恢复状态信息以后,可以得知那些UNASSIGNED的shard,在这个结点上存在数据。
重新设置cluster.routing.allocation.enable" : "all" ,master得到指令,开始恢复那些UNASSIGNED的shard
对于不再更新的冷shard,由于synced_flush, master知道这些数据在重启的结点上存在并且和primary一致,只需要更新一下集群的状态,将他们allocate到刚启动的结点,并且状态置为started。所以这个过程非常快,看起来瞬间可以完成。
由于集群持续有数据写入,部分primary由于新写入了数据,重启结点上对应的replica已经out of sync,因此需要进入数据的recovery过程,这个过程可能需要在主副片之间拷贝数据,或者利用translog重放热数据。 该过程取决于shard大小,以及实时数据写入量的大小,需要一些时间,可能几分钟到几个小时,直到primary -replica完全in-sync,才会将replica置为started。

 
如果同时重启2个或者更多结点,会是怎样的?
 
这种情况下,有可能某个shard的primary和replica同时变成UNASSIGNED了,集群状态变成red。  如果结点重启好全部加入集群,即使cluster.routing.allocation.enable设置为none,本地的primary shard因为不受这个参数约束,会立即开始做existing_store类别的恢复。 等全部primary恢复好以后,集群状态变成yellow,然后不再继续恢复replica,直到重新设置cluster.routing.allocation.enable为all。
 
所以,cluster.routing.allocation.enable: "none",实际上影响的是已有索引(local存在)的replica,以及新创建索引的primary和replica。
 
 
至于停掉结点后,集群查询延迟增加,是因为重启结点上的查询会由剩余的结点分担,多少延迟会增加一些。
 

multi_match+term的组合查询,能否提高term匹配的得分权重,让其排序在前面

回复

Elasticsearchlaoyang360 回复了问题 • 3 人关注 • 2 个回复 • 3784 次浏览 • 2024-01-26 20:59 • 来自相关话题

求助,ES对查询结果进行后置处理

回复

Elasticsearchlaoyang360 回复了问题 • 3 人关注 • 2 个回复 • 2335 次浏览 • 2024-01-07 22:22 • 来自相关话题

span_containing和span_with查询到底是什么意思?两者什么区别?

回复

ElasticsearchCharele 回复了问题 • 5 人关注 • 3 个回复 • 2966 次浏览 • 2023-09-08 16:14 • 来自相关话题

es局部更新文档字段

回复

Elasticsearchduanxiaobiao 回复了问题 • 2 人关注 • 1 个回复 • 4861 次浏览 • 2023-04-02 15:39 • 来自相关话题

ES 使用Join父子文档的方式能否一次查询,同时返回父文档和子文档的结果

回复

Elasticsearchlaoyang360 回复了问题 • 2 人关注 • 1 个回复 • 5039 次浏览 • 2023-02-08 10:31 • 来自相关话题

keyword类型的数字的大于小于查询

回复

Elasticsearchlaoyang360 回复了问题 • 3 人关注 • 3 个回复 • 1889 次浏览 • 2022-05-29 15:02 • 来自相关话题

elasticsearch疯狂的读磁盘是怎么回事?

回复

Elasticsearchpony_maggie 回复了问题 • 7 人关注 • 6 个回复 • 2721 次浏览 • 2020-12-03 12:35 • 来自相关话题

索引某个shard无法恢复的问题

回复

Elasticsearchshwtz 回复了问题 • 15 人关注 • 5 个回复 • 22710 次浏览 • 2020-08-31 11:20 • 来自相关话题

elasticsearch-6.2.2启动后CURL请求后报 master_not_discovered_exception错误

回复

Elasticsearchopewhgori 回复了问题 • 4 人关注 • 3 个回复 • 17656 次浏览 • 2020-08-16 11:45 • 来自相关话题

删除index下type的mapping

回复

Elasticsearchdadaball 回复了问题 • 2 人关注 • 1 个回复 • 2209 次浏览 • 2020-05-26 16:16 • 来自相关话题

关于数字.字母的匹配问题

回复

Elasticsearchsxwinter 回复了问题 • 5 人关注 • 6 个回复 • 4431 次浏览 • 2020-03-07 14:31 • 来自相关话题

Elasticsearch安装报错:max size virtual memory is too low, increase to [unlimited]

回复

Elasticsearchdamon10244201 回复了问题 • 3 人关注 • 2 个回复 • 8754 次浏览 • 2020-03-04 17:56 • 来自相关话题

long类型的时间字段date_histogram,extended_bounds,min无效?

回复

Elasticsearchyetao 回复了问题 • 5 人关注 • 2 个回复 • 7407 次浏览 • 2020-01-01 14:38 • 来自相关话题

修改Lucene源码,重新打包,替换elasticsearch中原有的Lucene-core.jar包,出现问题

回复

ElasticsearchKalasearch 回复了问题 • 2 人关注 • 1 个回复 • 6907 次浏览 • 2019-12-29 04:06 • 来自相关话题

elasticsearch索引生命周期管理

回复

Elasticsearchshaoyuwu 发起了问题 • 1 人关注 • 0 个回复 • 1917 次浏览 • 2019-12-24 20:48 • 来自相关话题

如何解决ES的性能问题

Elasticsearchsterne vencel 发表了文章 • 0 个评论 • 15439 次浏览 • 2018-07-10 21:56 • 来自相关话题

Part4:如何解决ES的性能问题 本文是对一篇外文博客的翻译 This post is the final part of a 4-part series on monitoring Elasticsearch performance. Part 1 provides an overview of Elasticsearch and its key performance metrics, Part 2 explains how to collect these metrics, and Part 3describes how to monitor Elasticsearch with Datadog. 这篇文章是监控ES性能系列文章的最后一部分。第1部分概述了ES及其关键性能指标,第2部分解释了如何收集这些指标,第3部分描述了如何使用Datadog监视ES。 Like a car, Elasticsearch was designed to allow its users to get up and running quickly, without having to understand all of its inner workings. However, it’s only a matter of time before you run into engine trouble here or there. This article will walk through five common Elasticsearch challenges, and how to deal with them. 就像汽车一样,用户可以在无需了解其所有内部工作原理的情况下,快速地站起来并运行。然而,在这里或那里遇到引擎故障只是时间问题。本文将介绍五种常见的ES的挑战,以及如何处理它们。 Problem #1: My cluster status is red or yellow. What should I do? 问题#1:我的集群状态是红色或黄色。我应该做什么?
21.png
If you recall from Part 1, cluster status is reported as red if one or more primary shards (and its replicas) is missing, and yellow if one or more replica shards is missing. Normally, this happens when a node drops off the cluster for whatever reason (hardware failure, long garbage collection time, etc.). Once the node recovers, its shards will remain in an initializing state before they transition back to active status. 回顾第1部分,如果丢失一个或多个主分片(及其副本),集群状态将报告为红色;如果丢失一个或多个副本分片,则报告为黄色。通常,这种情况发生在节点出于某些原因(硬件故障、长时间的垃圾收集时间等)退出集群时。一旦节点恢复,它的分片在转换会活跃状态之前将保持初始化状态。 The number of initializing shards typically peaks when a node rejoins the cluster, and then drops back down as the shards transition into an active state, as shown in the graph below. 初始化碎片的数量通常在节点重新加入集群时达到峰值,然后随着分片转换为活跃状态而下降,如下图所示。
22.png
During this initialization period, your cluster state may transition from green to yellow or red until the shards on the recovering node regain active status. In many cases, a brief status change to yellow or red may not require any action on your part. 在此初始化期间,集群状态可能从绿色转变为黄色或红色,直到恢复节点上的分片重新恢复到活跃状态。在很多情况下,一个简短的状态变化为黄色或红色可能不需要你的任何行动。
23.png
However, if you notice that your cluster status is lingering in red or yellow state for an extended period of time, verify that the cluster is recognizing the correct number of Elasticsearch nodes, either by consulting Datadog’s dashboard or by querying the Cluster Health API detailed in Part 2. 但是,如果您注意到您的集群状态在红色或黄色状态中徘徊了很长一段时间,请通过查阅Datadog的仪表板或查询第2部分中详细介绍的集群健康API来验证集群是否识别了正确的ES节点数量。
24.png
If the number of active nodes is lower than expected, it means that at least one of your nodes lost its connection and hasn’t been able to rejoin the cluster. To find out which node(s) left the cluster, check the logs (located by default in the logs folder of your Elasticsearch home directory) for a line similar to the following: 如果活动节点的数量低于预期,则意味着至少有一个节点失去了连接,无法重新加入集群。要找出离开集群的节点,请检查日志(默认位于您的Elasticsearch home目录的logs文件夹中),查找与以下内容类似的行::
[TIMESTAMP] ... Cluster health status changed from [GREEN] to [RED]
Reasons for node failure can vary, ranging from hardware or hypervisor failures, to out-of-memory errors. Check any of the monitoring tools outlined here for unusual changes in performance metrics that may have occurred around the same time the node failed, such as a sudden spike in the current rate of search or indexing requests. Once you have an idea of what may have happened, if it is a temporary failure, you can try to get the disconnected node(s) to recover and rejoin the cluster. If it is a permanent failure, and you are not able to recover the node, you can add new nodes and let Elasticsearch take care of recovering from any available replica shards; replica shards can be promoted to primary shards and redistributed on the new nodes you just added. 节点失败的原因可能不同,从硬件失败,管理程序失败到内存不足的错误。检查监视工具,这些工具可能是在节点失败的同时出现的性能指标的异常变化,比如当前搜索或索引请求的速度突然激增。一旦您知道可能发生了什么,如果是临时故障,您可以尝试让断开连接的节点恢复并重新加入集群。如果是永久性故障,您无法恢复节点,您可以添加新节点,并让Elasticsearch负责从任何可用的副本分片中恢复,副本分片可以提升到主分片,并在刚刚添加的新节点上重新分布。 However, if you lost both the primary and replica copy of a shard, you can try to recover as much of the missing data as possible by using Elasticsearch’s snapshot and restore module. If you’re not already familiar with this module, it can be used to store snapshots of indices over time in a remote repository for backup purposes. 但是,如果您同时丢失了分片的主分片和副本,那么您可以使用ES的快照和恢复模块尽可能多地恢复丢失的数据。如果您还不熟悉这个模块,那么可以使用它在远程存储库中存储索引的快照,以便进行备份。 Problem #2: Help! Data nodes are running out of disk space 问题#2:数据节点空间将要耗尽
25.png
If all of your data nodes are running low on disk space, you will need to add more data nodes to your cluster. You will also need to make sure that your indices have enough primary shards to be able to balance their data across all those nodes. 如果所有数据节点的磁盘空间都很低,那么将需要向集群添加更多的数据节点。你还需要确保您的索引拥有足够的主分片,以便能够跨所有这些节点能够平衡它的数据。 However, if only certain nodes are running out of disk space, this is usually a sign that you initialized an index with too few shards. If an index is composed of a few very large shards, it’s hard for Elasticsearch to distribute these shards across nodes in a balanced manner. 但是,如果只有特定的节点耗尽了磁盘空间,这通常是你用了太多的分片在初始化索引的时候。如果一个索引是由一些非常大的分片组成的,那么用ES很难以一种平衡的方式在节点之间分布这些分片。 Elasticsearch takes available disk space into account when allocating shards to nodes. By default, it will not assign shards to nodes that have over 85 percent disk in use. In Datadog, you can set up a threshold alert to notify you when any individual data node’s disk space usage approaches 80 percent, which should give you enough time to take action. 当master将分片分配给节点时,ES会考虑到节点可用的磁盘空间。默认情况下,它不会将分片分配给使用超过85%磁盘的节点。在Datadog中,您可以设置一个阈值警报,当任何单个数据节点的磁盘空间使用量接近80%时通知您,这应该会给您足够的时间采取行动。 There are two remedies for low disk space. One is to remove outdated data and store it off the cluster. This may not be a viable option for all users, but, if you’re storing time-based data, you can store a snapshot of older indices’ data off-cluster for backup, and update the index settings to turn off replication for those indices. 对于低磁盘空间有两种补救方法。一种是删除过时的数据并将其存储在集群之外。对于所有用户来说,这可能不是一个可行的选择,但是,如果您正在存储基于时间的数据,您可以将旧索引的数据快照存储到集群之外进行备份,并更新索引设置,以关闭对这些索引的复制。 The second approach is the only option for you if you need to continue storing all of your data on the cluster: scaling vertically or horizontally. If you choose to scale vertically, that means upgrading your hardware. However, to avoid having to upgrade again down the line, you should take advantage of the fact that Elasticsearch was designed to scale horizontally. To better accommodate future growth, you may be better off reindexing the data and specifying more primary shards in the newly created index (making sure that you have enough nodes to evenly distribute the shards). 如果需要继续将所有数据存储在集群上,那么第二种方法是惟一的选择:垂直或横向地伸缩集群。如果选择垂直伸缩,就意味着升级硬件。然而,为了避免再次升级,最好使用ES的横向伸缩。为了更好地适应未来的增长,你最好对数据进行索引重建,并在新创建的索引中指定更多的主碎片(确保您有足够的节点来均匀分布碎片)。 Another way to scale horizontally is to roll over the index by creating a new index, and using an alias to join the two indices together under one namespace. Though there is technically no limit to how much data you can store on a single shard, Elasticsearch recommends a soft upper limit of 50 GB per shard, which you can use as a general guideline that signals when it’s time to start a new index. 横向扩展的另一种方法是创建一个新索引,并使用别名滚动改变索引。虽然从技术上讲,您可以在一个分片上存储多少数据没有限制,但Elasticsearch建议在每个碎片上设置一个50 GB的软上限,您可以将其作为一个通用指南,在开始创建新索引时发出信号。 Problem #3: My searches are taking too long to execute 问题#3:我的搜索执行时间太长了 Search performance varies widely according to what type of data is being searched and how each query is structured. Depending on the way your data is organized, you may need to experiment with a few different methods before finding one that will help speed up search performance. We’ll cover two of them here: custom routing and force merging. 根据搜索的数据类型以及每个查询的结构,搜索性能会有很大的不同。根据您的数据的组织方式,您可能需要在找到一个有助于提高搜索性能的方法之前尝试一些不同的方法。我们将介绍其中的两个:自定义路由和强制合并。 Typically, when a node receives a search request, it needs to communicate that request to a copy (either primary or replica) of every shard in the index. Custom routing allows you to store related data on the same shard, so that you only have to search a single shard to satisfy a query. 通常,当一个节点收到一个搜索请求时,它需要将该请求传递给索引中的每个分片的副本(主分片和副本分片)。自定义路由允许你将相关数据存储在同一个shard上,这样您只需要搜索一个分片来满足查询。 For example, you can store all of blogger1’s data on the same shard by specifying a _routing value in the mapping for the blogger type within your index, blog_index. 例如,你可以在索引blog_index中为blogger类型指定一个_routing值,从而将blogger1的所有数据存储在相同的分片上。 First, make sure _routing is required so that you don’t forget to specify a custom routing value whenever you index information of the blogger type. 首先,确保需要_routing,以便在索引blogger类型的信息时不会忘记指定一个定制的路由值。
curl -XPUT "localhost:9200/blog_index" -d '
{
  "mappings": {
    "blogger": {
      "_routing": {
        "required": true 
      }
    }
  }
}'
当您准备索引与blogger1相关的文档时,请指定路由值:
curl -XPUT "localhost:9200/blog_index/blogger/1?routing=blogger1" -d '
{
  "comment": "blogger1 made this cool comment"
}'
Now, in order to search through blogger1’s comments, you will need to remember to specify the routing value in the query like this: 现在,为了搜索blogger1的评论,您需要记住在查询中指定如下的路由值:
curl -XGET "localhost:9200/blog_index/_search?routing=blogger1" -d '
{
  "query": {
    "match": {
      "comment": {
        "query": "cool comment"
      }
    }
  }
}'
In Elasticsearch, every search request has to check every segment of each shard it hits. So once you have reduced the number of shards you’ll have to search, you can also reduce the number of segments per shard by triggering the Force Merge API on one or more of your indices. The Force Merge API (or Optimize API in versions prior to 2.1.0) prompts the segments in the index to continue merging until each shard’s segment count is reduced to max_num_segments (1, by default). It’s worth experimenting with this feature, as long as you account for the computational cost of triggering a high number of merges. 在ES中,每个搜索请求都必须检查它所命中的每个分片的每一段。一旦你可以减少了搜索的分片数量,你也可以通过在一个或多个索引上触发Force Merge API来减少每个分片的段数量。强制合并API(或在2.1.0之前的版本中优化API)提示索引中的段合并,直到每个分片的段计数减少到max_num_segment(默认为1)。考虑一下这个成本和查询的时间成本,值得对该特性进行试验。 When it comes to shards with a large number of segments, the force merge process becomes much more computationally expensive. For instance, force merging an index of 10,000 segments down to 5,000 segments doesn’t take much time, but merging 10,000 segments all the way down to one segment can take hours. The more merging that must occur, the more resources you take away from fulfilling search requests, which may defeat the purpose of calling a force merge in the first place. In any case, it’s usually a good idea to schedule a force merge during non-peak hours, such as overnight, when you don’t expect many search or indexing requests. 当涉及到索引具有大量的段,段合并过程的计算开销就会大得多。例如,强制合并10000个段的索引到5000个段并不需要花费太多时间,但是将10000个段一直合并到一个段需要花费数小时。合并越多,搜索请求越快,这是调用force merge的目的。在任何情况下,通常最好在非高峰时间(比如在一夜之间)安排一个force merge,这样就不会有太多的搜索或索引请求。 Problem #4: How can I speed up my index-heavy workload? 问题#4:怎样才能加快我的索引沉重的工作量? Elasticsearch comes pre-configured with many settings that try to ensure that you retain enough resources for searching and indexing data. However, if your usage of Elasticsearch is heavily skewed towards writes, you may find that it makes sense to tweak certain settings to boost indexing performance, even if it means losing some search performance or data replication. Below, we will explore a number of methods to optimize your use case for indexing, rather than searching, data. ES具有许多预先配置的设置,这些设置试图确保您保留足够的资源用于搜索和索引数据。但是,如果您对ES的使用严重偏向于写操作,可能会发现调整某些设置以提高索引性能是有意义的,即使这意味着丢失一些搜索性能或数据副本。下面,我们将探索一些方法来优化索引而不是优化搜索性能。 Shard allocation: As a high-level strategy, if you are creating an index that you plan to update frequently, make sure you designate enough primary shards so that you can spread the indexing load evenly across all of your nodes. The general recommendation is to allocate one primary shard per node in your cluster, and possibly two or more primary shards per node, but only if you have a lot of CPU and disk bandwidth on those nodes. However, keep in mind that shard overallocation adds overhead and may negatively impact search, since search requests need to hit every shard in the index. On the other hand, if you assign fewer primary shards than the number of nodes, you may create hotspots, as the nodes that contain those shards will need to handle more indexing requests than nodes that don’t contain any of the index’s shards. 分片分配:作为一种高级策略,如果你正在创建频繁更新索引的集群,请确保指定了足够的主分片,这样你就可以将索引负载均匀地分布到所有节点上。一般的建议是为集群中的每个节点分配一个主分片,可能为每个节点分配两个或多个主分片,但前提是这些节点上有大量的CPU和磁盘带宽。但是,请记住,分片过度分配会增加开销,并可能对搜索产生负面影响,因为搜索请求需要命中索引中的每个分片。另一方面,如果你分配的主碎片数量少于节点数量,那么您可能会创建热点(热节点),因为包含这些分片的节点将需要处理更多的索引请求,而不包含索引分片的节点将不做什么操作。 Disable merge throttling: Merge throttling is Elasticsearch’s automatic tendency to throttle indexing requests when it detects that merging is falling behind indexing. It makes sense to update your cluster settings to disable merge throttling (by setting indices.store.throttle.type to “none”) if you want to optimize indexing performance, not search. You can make this change persistent (meaning it will persist after a cluster restart) or transient (resets back to default upon restart), based on your use case. 禁用合并节流:合并节流是ES在检测到合并落后于索引时自动抑制索引请求的趋势。更新集群设置以禁用合并节流是有意义的(设置index .store.throttle.type为none)。这样做可以优化索引性能,而不是搜索。根据你的用例,你可以使这个设置为persist(意味着在集群重新启动之后它将持续)或transient(在重新启动时重新设置为默认)。 Increase the size of the indexing buffer: This setting (indices.memory.index_buffer_size) determines how full the buffer can get before its documents are written to a segment on disk. The default setting limits this value to 10 percent of the total heap in order to reserve more of the heap for serving search requests, which doesn’t help you if you’re using Elasticsearch primarily for indexing. 增加索引缓冲区的大小:此设置(indices.memory.index_buffer_size)确定将文档写到磁盘上的段之前缓冲区的容量。默认设置限制为总堆的10%,以便为服务搜索请求保留更多的堆,如果您主要是在使用Elasticsearch进行索引,这对你是没有帮助。 Index first, replicate later: When you initialize an index, specify zero replica shards in the index settings, and add replicas after you’re done indexing. This will boost indexing performance, but it can be a bit risky if the node holding the only copy of the data crashes before you have a chance to replicate it. *先索引,后复制:初始化索引时,在索引设置中指定0个复制碎片,索引完成后添加副本。这将提高索引性能,但如果拥有数据惟一副本的节点在您有机会复制数据之前崩溃,则可能存在一些风险。 Refresh less frequently: Increase the refresh interval in the Index Settings API. By default, the index refresh process occurs every second, but during heavy indexing periods, reducing the refresh frequency can help alleviate some of the workload. 不经常刷新:增加索引设置API中的刷新间隔。默认情况下,索引refresh过程每秒钟发生一次,但是在索引不断更新的时期,减少刷新频率可以帮助减轻一些工作负载。 Tweak your translog settings: As of version 2.0, Elasticsearch will flush translog data to disk after every request, reducing the risk of data loss in the event of hardware failure. If you want to prioritize indexing performance over potential data loss, you can change index.translog.durability to async in the index settings. With this in place, the index will only commit writes to disk upon every sync_interval, rather than after each request, leaving more of its resources free to serve indexing requests. 调整您的translog设置:在2.0版本中,弹性搜索将在每次请求之后将translog数据刷新到磁盘,从而在硬件故障时降低数据丢失的风险。如果希望将索引性能优先于潜在的数据丢失,可以更改index.translog.durability为async。有了这一点,索引将在sync_interval上提交对磁盘的写操作,而不是在每个请求之后,从而使更多的资源可以用于索引请求。 For more suggestions on boosting indexing performance, check out this guide from Elastic. 有关提高索引性能的更多建议,请参阅《ES》。 Problem #5: What should I do about all these bulk thread pool rejections? 问题#5:对于所有这些大容量线程池拒绝,我应该怎么做?
26.png
Thread pool rejections are typically a sign that you are sending too many requests to your nodes, too quickly. If this is a temporary situation (for instance, you have to index an unusually large amount of data this week, and you anticipate that it will return to normal soon), you can try to slow down the rate of your requests. However, if you want your cluster to be able to sustain the current rate of requests, you will probably need to scale out your cluster by adding more data nodes. In order to utilize the processing power of the increased number of nodes, you should also make sure that your indices contain enough shards to be able to spread the load evenly across all of your nodes. 线程池的拒绝通常表明向节点发送了过多的请求或者请求速度太快。如果这是一个临时的情况(例如,本周必须索引超大量的数据,并且预期它将很快恢复正常),可以尝试降低请求的速度。但是,如果您希望集群能够维持当前的请求速率,您可能需要通过添加更多的数据节点来扩展集群。为了利用增加的节点数量的处理能力,还应该确保索引包含足够的分片,以便能够在所有节点上均匀地分配负载。 Go forth and optimize! 优化 Even more performance tips are available in Elasticsearch’s learning resources and documentation. Since results will vary depending on your particular use case and setup, you can test out different settings and indexing/querying strategies to determine which approaches work best for your clusters. 在ES的学习资源和文档中可以找到更多的性能技巧。由于结果将根据您的特定用例和设置而变化,您可以测试不同的设置和索引/查询策略,以确定哪种方法最适合您的集群。 As you experiment with these and other optimizations, make sure to watch your Elasticsearch dashboards closely to monitor the resulting impact on your clusters’ key Elasticsearch performance metrics. 当您尝试这些优化和其他优化时,请确保密切关注您的ES仪表盘,以监视由此对集群的关键ES性能指标的影响。 With a built-in Elasticsearch dashboard that highlights key cluster metrics, Datadog enables you to effectively monitor Elasticsearch in real-time. If you already have a Datadog account, you can set up the Elasticsearch integrationin minutes. If you don’t yet have a Datadog account, sign up for a free trialtoday. 有了一个内置的ES仪表盘,它突出关键的集群指标,Datadog使您能够实时监控弹性搜索。如果您已经有了一个Datadog帐户,那么您可以在几分钟内设置Elasticsearch集成。如果你还没有一个Datadog帐户,那么今天就注册一个免费试用。 Source Markdown for this post is available on GitHub. Questions, corrections, additions, etc.? Please let us know.

社区日报 第323期 (2018-07-05)

社区日报sterne vencel 发表了文章 • 0 个评论 • 1432 次浏览 • 2018-07-05 09:34 • 来自相关话题

1.使用python操作ES http://t.cn/RBzKP6H 2.使用Beats模块将日志和指标导入ES http://t.cn/RdLtJJp 3.如何在生产环境中重启Elasticsearch集群 http://t.cn/RdL4oxk  活动预告 1. 7月21日上海meetup演讲申请中 https://elasticsearch.cn/m/article/655  编辑:sterne vencel 归档:https://elasticsearch.cn/article/700 订阅:https://tinyletter.com/elastic-daily

_validate/query?explain解释

Elasticsearchhnj1575565068 发表了文章 • 0 个评论 • 2179 次浏览 • 2018-04-24 10:33 • 来自相关话题

使用_validate/query?explain API得到的结果如下,Synonym是什么意思啊?同义词吗?求解释{   "valid": true,   "_shards": {     "total": 1,     "successful": 1,     "failed": 0   },   "explanations": [     {       "index": "country",       "valid": true,       "explanation": "name:z Synonym(name:g name:zg)"     }   ] }

php的操作类库,通过写sql来转化dsl来查询elasticsearch

Elasticsearchqieangel2013 发表了文章 • 1 个评论 • 5400 次浏览 • 2018-03-21 15:44 • 来自相关话题

EsParser

php的操作类库,通过写sql来转化dsl来查询elasticsearch

composer使用

{
    "require": {
        "qieangel2013/esparser": "dev-master"
    }
}
composer install
require __DIR__.'/vendor/autoload.php';
$sql = 'select * from alp_dish_sales_saas where sid in(994,290) limit 1,10';
//$sql='update alp_dish_sales_saas set mid=3  where adsid=15125110';
//$sql='delete from alp_dish_sales_saas where adsid=15546509';
$es_config=array(
    'index' =>"alp_dish_sales_saas",
    'type'  =>"alp_dish_sales_saas",
    'url'   =>"http://127.0.0.1:9200",
    'version' =>"5.x" //1.x 2.x 5.x 6.x,可以不配置,系统会请求获取版本,这样会多一次请求,建议配置一下
 );
$parser = new EsParser($sql, true,$es_config);//第三个参数是es的配置参数,一定要配置
print_r($parser->result);//打印结果
//print_r($parser->explain());//打印dsl

普通调用

require_once dirname(__FILE__) . '/src/library/EsParser.php';
$sql = 'select * from alp_dish_sales_saas where sid in(994,290) limit 1,10';
//$sql='update alp_dish_sales_saas set mid=3  where adsid=15125110';
//$sql='delete from alp_dish_sales_saas where adsid=15546509';
$es_config=array(
        'index' =>"alp_dish_sales_saas",
        'type'  =>"alp_dish_sales_saas",
        'url'   =>"http://127.0.0.1:9200",
        'version' =>"5.x" //1.x 2.x 5.x 6.x,可以不配置,系统会请求获取版本,这样会多一次请求,建议配置一下
    );
$parser = new EsParser($sql, true,$es_config);//第三个参数是es的配置参数,一定要配置
print_r($parser->result);//打印结果
//print_r($parser->explain()); //打印dsl

目前支持的sql函数

*  SQL Select
*  SQL Delete
*  SQL Update
*  SQL Where
*  SQL Order By
*  SQL Group By
*  SQL AND & OR 
*  SQL Like
*  SQL COUNT distinct
*  SQL In
*  SQL avg()
*  SQL count()
*  SQL max()
*  SQL min()
*  SQL sum()
*  SQL Between
*  SQL Aliases

使用注意事项

请在配置项填写es的版本,这样系统不会请求获取版本,这样不会多一次请求,建议配置一下

交流使用

qq群:578276199

项目地址

github:https://github.com/qieangel2013/EsParser
oschina:https://gitee.com/qieangel2013/EsParser

elasticsearch参考手册 (译文)

Elasticsearchcode4j 发表了文章 • 2 个评论 • 5956 次浏览 • 2018-03-14 00:29 • 来自相关话题

一直以来官方手册都是零散的阅读,没有完整的看过,导致对es很多功能还有使用细节并不是非常了解。   然后最近也是在debug 看源码,顺便想把官方文档也刷了,决定开始自己翻译 elasticsearch 官方参考手册。看到之前网上有人在翻译但是没有翻译完,自己也尝试一下。   公司用的是2.2版本的所以我就从这个版本开始翻译了,译文中会有一些批注,后续会持续关注高版本并把特性以批注的方式补上说明。   在线阅读: www.code4j.tech   github地址:https://github.com/rpgmakervx/ ... ation   掘金翻译计划:https://github.com/xitu/gold-miner   计划每周翻译两三篇吧,看情况。   英语只有六级啦,有些地方翻译起来也很笨拙,有翻译不恰当之处大家可以提issue呀!

java 客户端 获取 termvectors

ElasticsearchJiaShiwen 发表了文章 • 0 个评论 • 4220 次浏览 • 2018-01-19 15:56 • 来自相关话题

elasticsearch的termvectors包括了term的位置、词频等信息。这些信息用于相应的数据统计或开发其他功能,本文介绍termvecters如何使用,如何通过java客户端获取termvectors相关信息。

要使用termvctor首先要配置mapping中field的"term_vector"属性,默认状态es不开启termvector,因为这样会增加索引的体积,毕竟多存了不少元数据。

PUT test
{
  "mappings": {
    "qa_test": {
      "dynamic": "strict",
      "_all": {
        "enabled": false
      },
      "properties": {
        "question": {
          "properties": {
            "cate": {
              "type": "keyword"
            },
            "desc": {
              "type": "text",
              "store": true,
              "term_vector": "with_positions_offsets_payloads",
              "analyzer": "ik_smart"
            },
            "time": {
              "type": "date",
              "store": true,
              "format": "strict_date_optional_time||epoch_millis||yyyy-MM-dd HH:mm:ss"
            },
            "title": {
              "type": "text",
              "store": true,
              "term_vector": "with_positions_offsets_payloads",
              "analyzer": "ik_smart"
            }
          }
        },
        "updatetime": {
          "type": "date",
          "store": true,
          "format": "strict_date_optional_time||epoch_millis||yyyy-MM-dd HH:mm:ss"
        }
      }
    }
  },
  "settings": {
    "index": {
      "number_of_shards": "1",
      "requests": {
        "cache": {
          "enable": "true"
        }
      },
      "number_of_replicas": "1"
    }
  }
}

注意示例中的"title"的"term_vector"属性。

接下来为索引创建一条数据

PUT qa_test_02/qa_test/1
{
  "question": {
    "cate": [
      "装修流程",
      "其它"
    ],
    "desc": "筒灯,大洋和索正这两个牌子,哪个好?希望内行的朋友告知一下,谢谢!",
    "time": "2016-07-02 19:59:00",
    "title": "筒灯大洋和索正这两个牌子哪个好"
  },
  "updatetime": 1467503940000
}

下面我们看看这条数据上question.title字段的termvector信息

GET qa_test_02/qa_test/1/_termvectors
{
  "fields": [
    "question.title"
  ],
  "offsets": true,
  "payloads": true,
  "positions": true,
  "term_statistics": true,
  "field_statistics": true
}

结果大概这个样子

{
  "_index": "qa_test_02",
  "_type": "qa_test",
  "_id": "1",
  "_version": 1,
  "found": true,
  "took": 0,
  "term_vectors": {
    "question.title": {
      "field_statistics": {
        "sum_doc_freq": 9,
        "doc_count": 1,
        "sum_ttf": 9
      },
      "terms": {
        "和": {
          "doc_freq": 1,
          "ttf": 1,
          "term_freq": 1,
          "tokens": [
            {
              "position": 2,
              "start_offset": 4,
              "end_offset": 5
            }
          ]
        },
        "哪个": {
          "doc_freq": 1,
          "ttf": 1,
          "term_freq": 1,
          "tokens": [
            {
              "position": 7,
              "start_offset": 12,
              "end_offset": 14
            }
          ]
        },
        "大洋": {
          "doc_freq": 1,
          "ttf": 1,
          "term_freq": 1,
          "tokens": [
            {
              "position": 1,
              "start_offset": 2,
              "end_offset": 4
            }
          ]
        },
        "好": {
          "doc_freq": 1,
          "ttf": 1,
          "term_freq": 1,
          "tokens": [
            {
              "position": 8,
              "start_offset": 14,
              "end_offset": 15
            }
          ]
        },
        "正": {
          "doc_freq": 1,
          "ttf": 1,
          "term_freq": 1,
          "tokens": [
            {
              "position": 4,
              "start_offset": 6,
              "end_offset": 7
            }
          ]
        },
        "牌子": {
          "doc_freq": 1,
          "ttf": 1,
          "term_freq": 1,
          "tokens": [
            {
              "position": 6,
              "start_offset": 10,
              "end_offset": 12
            }
          ]
        },
        "筒灯": {
          "doc_freq": 1,
          "ttf": 1,
          "term_freq": 1,
          "tokens": [
            {
              "position": 0,
              "start_offset": 0,
              "end_offset": 2
            }
          ]
        },
        "索": {
          "doc_freq": 1,
          "ttf": 1,
          "term_freq": 1,
          "tokens": [
            {
              "position": 3,
              "start_offset": 5,
              "end_offset": 6
            }
          ]
        },
        "这两个": {
          "doc_freq": 1,
          "ttf": 1,
          "term_freq": 1,
          "tokens": [
            {
              "position": 5,
              "start_offset": 7,
              "end_offset": 10
            }
          ]
        }
      }
    }
  }
}

下面我们说说如何通过java代码实现termvector的获取,不说废话直接上代码

            TermVectorsResponse     termVectorResponse = client.prepareTermVectors().setIndex(sourceindexname).setType(sourceindextype)
                        .setId(id).setSelectedFields(fieldname).setTermStatistics(true).execute()
                        .actionGet();
                XContentBuilder builder = XContentFactory.contentBuilder(XContentType.JSON);
                termVectorResponse.toXContent(builder, null);
                System.out.println(builder.string());
                Fields fields = termVectorResponse.getFields();
                Iterator<String> iterator = fields.iterator();
                while (iterator.hasNext()) {
                    String field = iterator.next();
                    Terms terms = fields.terms(field);
                    TermsEnum termsEnum = terms.iterator();
                    while (termsEnum.next() != null) {
                        BytesRef term = termsEnum.term();
                        if (term != null) {
                            System.out.println(term.utf8ToString() + termsEnum.totalTermFreq());
                        }
                    }
                }

获取TermVectorsResponse的代码很好理解,主要是设置索引名称、索引type、索引id以及需要展示的若干属性。

接下来是如何获取某一term的termvector,有两种方案第一种是通过TermVectorsResponse的toXContent方法直接生成XContentBuilder,这种方法可以直接获取和上面通过DSL查询一样的json结果;第二种是通过Fields的iterator遍历fields,获取TermsEnum,熟悉lucene的同学应会更熟悉第二种方法。

elasticsearch批量导入数据注意事项

Elasticsearchwj86611199 发表了文章 • 0 个评论 • 10861 次浏览 • 2017-12-16 23:55 • 来自相关话题

刚刚初始化启动kiabna后是没有索引的,当然,如果elasticsearch中导入过数据那么kibana会自动匹配索引 现在按照官方例子开始批量给elasticsearch导入数据 链接如下https://www.elastic.co/guide/e ... .html 我们会依次导入如下 三块数据  1.The Shakespeare data 莎士比亚文集的数据结构 {     "line_id": INT,     "play_name": "String",     "speech_number": INT,     "line_number": "String",     "speaker": "String",     "text_entry": "String", } 2.The accounts data  账户数据结构 {     "account_number": INT,     "balance": INT,     "firstname": "String",     "lastname": "String",     "age": INT,     "gender": "M or F",     "address": "String",     "employer": "String",     "email": "String",     "city": "String",     "state": "String" } 3.The schema for the logs data 日志数据 {     "memory": INT,     "geo.coordinates": "geo_point"     "@timestamp": "date" } 然后向elasticsearch设置字段映射 Use the following command in a terminal (eg bash) to set up a mapping for the Shakespeare data set: 以下是莎士比亚的字段映射 可以用postman或者curl等发出请求~完整的url应该是localhost:9200/shakespear PUT /shakespeare {  "mappings": {   "doc": {    "properties": {     "speaker": {"type": "keyword"},     "play_name": {"type": "keyword"},     "line_id": {"type": "integer"},     "speech_number": {"type": "integer"}    }   }  } } Use the following commands to establish geo_point mapping for the logs: 这是 logs的字段映射 PUT /logstash-2015.05.18 {   "mappings": {     "log": {       "properties": {         "geo": {           "properties": {             "coordinates": {               "type": "geo_point"             }           }         }       }     }   } }   PUT /logstash-2015.05.19 {   "mappings": {     "log": {       "properties": {         "geo": {           "properties": {             "coordinates": {               "type": "geo_point"             }           }         }       }     }   } } COPY AS CURLVIEW IN CONSOLE  PUT /logstash-2015.05.20 {   "mappings": {     "log": {       "properties": {         "geo": {           "properties": {             "coordinates": {               "type": "geo_point"             }           }         }       }     }   } } 账户信息没有字段映射。。。 现在批量导入 curl -H 'Content-Type: application/x-ndjson' -XPOST 'localhost:9200/bank/account/_bulk?pretty' --data-binary @accounts.json curl -H 'Content-Type: application/x-ndjson' -XPOST 'localhost:9200/shakespeare/doc/_bulk?pretty' --data-binary @shakespeare_6.0.json curl -H 'Content-Type: application/x-ndjson' -XPOST 'localhost:9200/_bulk?pretty' --data-binary @logs.jsonl windows下的curl命令可以到https://curl.haxx.se/download.html#Win64下载,解压后设置环境变量即可 这里要注意的是 @accounts.json,@shakespeare_6.0.json,@logs.json这些文件的位置应该是你所在的当前目录, 如果你当前位置是D盘~那么这些文件位置就要放在D盘下,否则读不到 还有一点~~~windows下要把命令行中的单引号换成双引号,,。。。否则会报 curl: (6) Could not resolve host: application这样的错误  

Elasticsearch 5.6 Java API 中文手册

Elasticsearchquanke 发表了文章 • 1 个评论 • 25144 次浏览 • 2017-11-08 22:30 • 来自相关话题

432952-5448f57c503678f5.jpg
 [Elasticsearch 5.6 Java API 中文手册] 本手册由 全科 翻译,并且整理成电子书,支持PDF,ePub,Mobi格式,方便大家下载阅读。 不只是官方文档的翻译,还包含使用实例,包含我们使用踩过的坑 阅读地址:https://es.quanke.name 下载地址:https://www.gitbook.com/book/q ... -java github地址:https://github.com/quanke/elasticsearch-java 编辑:http://quanke.name 编辑整理辛苦,还望大神们点一下star ,抚平我虚荣的心 [全科的公众号]
08183543_ysUa.jpg
 

ElasticSearch 集群监控

Elasticsearchzhisheng 发表了文章 • 3 个评论 • 10113 次浏览 • 2017-11-07 00:41 • 来自相关话题

原文地址:http://www.54tianzhisheng.cn/2017/10/15/ElasticSearch-cluster-health-metrics/  

最近在做 ElasticSearch 的信息(集群和节点)监控,特此稍微整理下学到的东西。这篇文章主要介绍集群的监控。

要监控哪些 ElasticSearch metrics

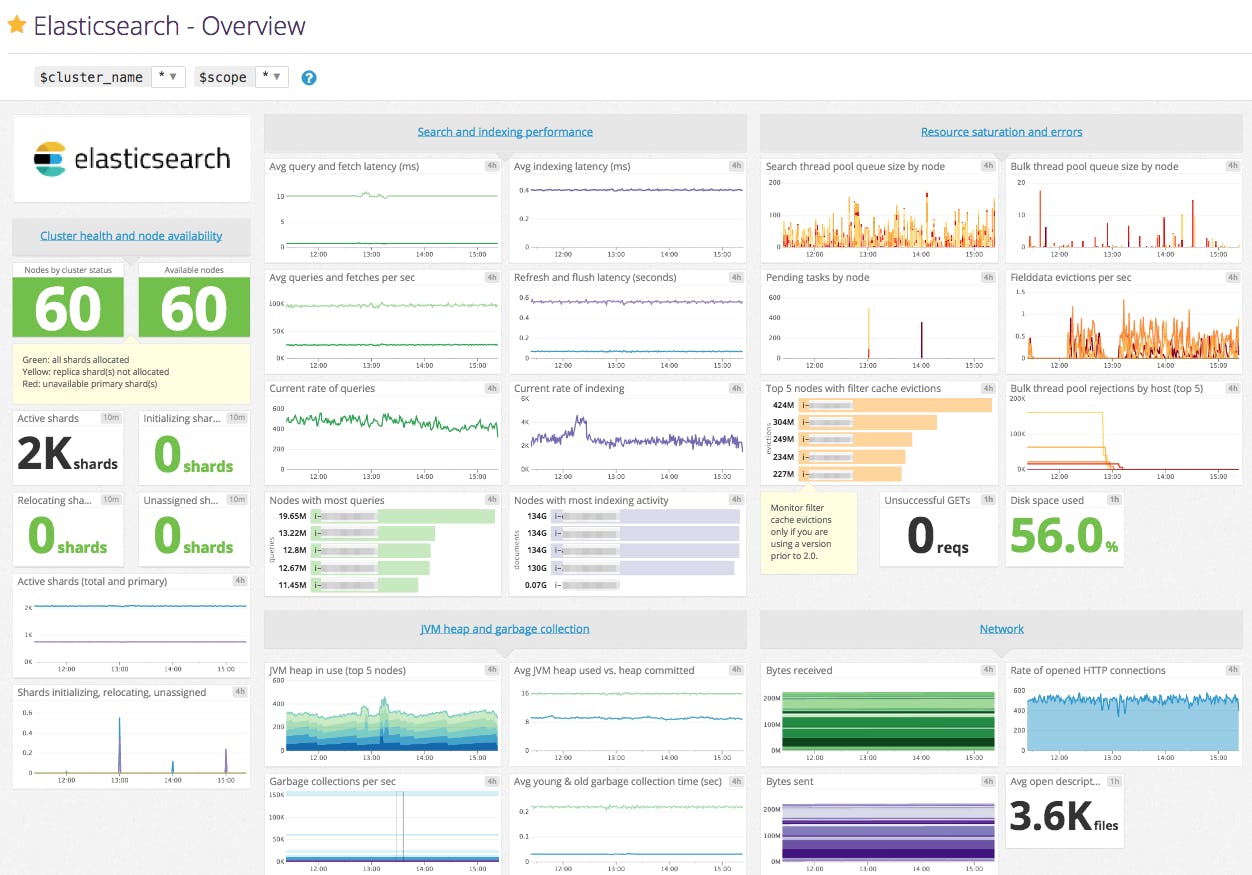
Elasticsearch 提供了大量的 Metric,可以帮助您检测到问题的迹象,在遇到节点不可用、out-of-memory、long garbage collection times 的时候采取相应措施。但是指标太多了,有时我们并不需要这么多,这就需要我们进行筛选。

集群健康

一个 Elasticsearch 集群至少包括一个节点和一个索引。或者它 可能有一百个数据节点、三个单独的主节点,以及一小打客户端节点——这些共同操作一千个索引(以及上万个分片)。

不管集群扩展到多大规模,你都会想要一个快速获取集群状态的途径。Cluster Health API 充当的就是这个角色。你可以把它想象成是在一万英尺的高度鸟瞰集群。它可以告诉你安心吧一切都好,或者警告你集群某个地方有问题。

让我们执行一下 cluster-health API 然后看看响应体是什么样子的:

GET _cluster/health

和 Elasticsearch 里其他 API 一样,cluster-health 会返回一个 JSON 响应。这对自动化和告警系统来说,非常便于解析。响应中包含了和你集群有关的一些关键信息:

{
   "cluster_name": "elasticsearch_zach",
   "status": "green",
   "timed_out": false,
   "number_of_nodes": 1,
   "number_of_data_nodes": 1,
   "active_primary_shards": 10,
   "active_shards": 10,
   "relocating_shards": 0,
   "initializing_shards": 0,
   "unassigned_shards": 0
}

响应信息中最重要的一块就是 status 字段。状态可能是下列三个值之一 :

status 含义
green 所有的主分片和副本分片都已分配。你的集群是 100% 可用的。
yellow 所有的主分片已经分片了,但至少还有一个副本是缺失的。不会有数据丢失,所以搜索结果依然是完整的。不过,你的高可用性在某种程度上被弱化。如果 更多的 分片消失,你就会丢数据了。把 yellow 想象成一个需要及时调查的警告。
red 至少一个主分片(以及它的全部副本)都在缺失中。这意味着你在缺少数据:搜索只能返回部分数据,而分配到这个分片上的写入请求会返回一个异常。
  • number_of_nodesnumber_of_data_nodes 这个命名完全是自描述的。
  • active_primary_shards 指出你集群中的主分片数量。这是涵盖了所有索引的汇总值。
  • active_shards 是涵盖了所有索引的所有分片的汇总值,即包括副本分片。
  • relocating_shards 显示当前正在从一个节点迁往其他节点的分片的数量。通常来说应该是 0,不过在 Elasticsearch 发现集群不太均衡时,该值会上涨。比如说:添加了一个新节点,或者下线了一个节点。
  • initializing_shards 是刚刚创建的分片的个数。比如,当你刚创建第一个索引,分片都会短暂的处于 initializing 状态。这通常会是一个临时事件,分片不应该长期停留在 initializing状态。你还可能在节点刚重启的时候看到 initializing 分片:当分片从磁盘上加载后,它们会从initializing 状态开始。
  • unassigned_shards 是已经在集群状态中存在的分片,但是实际在集群里又找不着。通常未分配分片的来源是未分配的副本。比如,一个有 5 分片和 1 副本的索引,在单节点集群上,就会有 5 个未分配副本分片。如果你的集群是 red 状态,也会长期保有未分配分片(因为缺少主分片)。

集群统计

集群统计信息包含 集群的分片数,文档数,存储空间,缓存信息,内存作用率,插件内容,文件系统内容,JVM 作用状况,系统 CPU,OS 信息,段信息。

查看全部统计信息命令:

curl -XGET 'http://localhost:9200/_cluster/stats?human&pretty'

返回 JSON 结果:

{
   "timestamp": 1459427693515,
   "cluster_name": "elasticsearch",
   "status": "green",
   "indices": {
      "count": 2,
      "shards": {
         "total": 10,
         "primaries": 10,
         "replication": 0,
         "index": {
            "shards": {
               "min": 5,
               "max": 5,
               "avg": 5
            },
            "primaries": {
               "min": 5,
               "max": 5,
               "avg": 5
            },
            "replication": {
               "min": 0,
               "max": 0,
               "avg": 0
            }
         }
      },
      "docs": {
         "count": 10,
         "deleted": 0
      },
      "store": {
         "size": "16.2kb",
         "size_in_bytes": 16684,
         "throttle_time": "0s",
         "throttle_time_in_millis": 0
      },
      "fielddata": {
         "memory_size": "0b",
         "memory_size_in_bytes": 0,
         "evictions": 0
      },
      "query_cache": {
         "memory_size": "0b",
         "memory_size_in_bytes": 0,
         "total_count": 0,
         "hit_count": 0,
         "miss_count": 0,
         "cache_size": 0,
         "cache_count": 0,
         "evictions": 0
      },
      "completion": {
         "size": "0b",
         "size_in_bytes": 0
      },
      "segments": {
         "count": 4,
         "memory": "8.6kb",
         "memory_in_bytes": 8898,
         "terms_memory": "6.3kb",
         "terms_memory_in_bytes": 6522,
         "stored_fields_memory": "1.2kb",
         "stored_fields_memory_in_bytes": 1248,
         "term_vectors_memory": "0b",
         "term_vectors_memory_in_bytes": 0,
         "norms_memory": "384b",
         "norms_memory_in_bytes": 384,
         "doc_values_memory": "744b",
         "doc_values_memory_in_bytes": 744,
         "index_writer_memory": "0b",
         "index_writer_memory_in_bytes": 0,
         "version_map_memory": "0b",
         "version_map_memory_in_bytes": 0,
         "fixed_bit_set": "0b",
         "fixed_bit_set_memory_in_bytes": 0,
         "file_sizes": {}
      },
      "percolator": {
         "num_queries": 0
      }
   },
   "nodes": {
      "count": {
         "total": 1,
         "data": 1,
         "coordinating_only": 0,
         "master": 1,
         "ingest": 1
      },
      "versions": [
         "5.6.3"
      ],
      "os": {
         "available_processors": 8,
         "allocated_processors": 8,
         "names": [
            {
               "name": "Mac OS X",
               "count": 1
            }
         ],
         "mem" : {
            "total" : "16gb",
            "total_in_bytes" : 17179869184,
            "free" : "78.1mb",
            "free_in_bytes" : 81960960,
            "used" : "15.9gb",
            "used_in_bytes" : 17097908224,
            "free_percent" : 0,
            "used_percent" : 100
         }
      },
      "process": {
         "cpu": {
            "percent": 9
         },
         "open_file_descriptors": {
            "min": 268,
            "max": 268,
            "avg": 268
         }
      },
      "jvm": {
         "max_uptime": "13.7s",
         "max_uptime_in_millis": 13737,
         "versions": [
            {
               "version": "1.8.0_74",
               "vm_name": "Java HotSpot(TM) 64-Bit Server VM",
               "vm_version": "25.74-b02",
               "vm_vendor": "Oracle Corporation",
               "count": 1
            }
         ],
         "mem": {
            "heap_used": "57.5mb",
            "heap_used_in_bytes": 60312664,
            "heap_max": "989.8mb",
            "heap_max_in_bytes": 1037959168
         },
         "threads": 90
      },
      "fs": {
         "total": "200.6gb",
         "total_in_bytes": 215429193728,
         "free": "32.6gb",
         "free_in_bytes": 35064553472,
         "available": "32.4gb",
         "available_in_bytes": 34802409472
      },
      "plugins": [
        {
          "name": "analysis-icu",
          "version": "5.6.3",
          "description": "The ICU Analysis plugin integrates Lucene ICU module into elasticsearch, adding ICU relates analysis components.",
          "classname": "org.elasticsearch.plugin.analysis.icu.AnalysisICUPlugin",
          "has_native_controller": false
        },
        {
          "name": "ingest-geoip",
          "version": "5.6.3",
          "description": "Ingest processor that uses looksup geo data based on ip adresses using the Maxmind geo database",
          "classname": "org.elasticsearch.ingest.geoip.IngestGeoIpPlugin",
          "has_native_controller": false
        },
        {
          "name": "ingest-user-agent",
          "version": "5.6.3",
          "description": "Ingest processor that extracts information from a user agent",
          "classname": "org.elasticsearch.ingest.useragent.IngestUserAgentPlugin",
          "has_native_controller": false
        }
      ]
   }
}

内存使用和 GC 指标

在运行 Elasticsearch 时,内存是您要密切监控的关键资源之一。 Elasticsearch 和 Lucene 以两种方式利用节点上的所有可用 RAM:JVM heap 和文件系统缓存。 Elasticsearch 运行在Java虚拟机(JVM)中,这意味着JVM垃圾回收的持续时间和频率将成为其他重要的监控领域。

上面返回的 JSON监控的指标有我个人觉得有这些:

  • nodes.successful
  • nodes.failed
  • nodes.total
  • nodes.mem.used_percent
  • nodes.process.cpu.percent
  • nodes.jvm.mem.heap_used

可以看到 JSON 文件是很复杂的,如果从这复杂的 JSON 中获取到对应的指标(key)的值呢,这里请看文章 :JsonPath —— JSON 解析神器

最后

这里主要讲下 ES 集群的一些监控信息,有些监控指标是个人觉得需要监控的,但是具体情况还是得看需求了。下篇文章主要讲节点的监控信息。转载请注明地址:http://www.54tianzhisheng.cn/2017/10/15/ElasticSearch-cluster-health-metrics/

参考资料

1、How to monitor Elasticsearch performance

2、ElasticSearch 性能监控

3、cluster-health

4、cluster-stats

相关阅读

1、Elasticsearch 默认分词器和中分分词器之间的比较及使用方法

2、全文搜索引擎 Elasticsearch 集群搭建入门教程

ElasticSearch 单个节点监控

Elasticsearchzhisheng 发表了文章 • 1 个评论 • 3360 次浏览 • 2017-11-07 00:39 • 来自相关话题

原文地址:http://www.54tianzhisheng.cn/2017/10/18/ElasticSearch-nodes-metrics/  

集群健康监控是对集群信息进行高度的概括,节点统计值 API 提供了集群中每个节点的统计值。节点统计值很多,在监控的时候仍需要我们清楚哪些指标是最值得关注的。

集群健康监控可以参考这篇文章:ElasticSearch 集群监控

节点信息   Node Info :

curl -XGET 'http://localhost:9200/_nodes'

执行上述命令可以获取所有 node 的信息

_nodes: {
  total: 2,
  successful: 2,
  failed: 0
},
cluster_name: "elasticsearch",
nodes: {
    MSQ_CZ7mTNyOSlYIfrvHag: {
    name: "node0",
    transport_address: "192.168.180.110:9300",
    host: "192.168.180.110",
    ip: "192.168.180.110",
    version: "5.5.0",
    build_hash: "260387d",
    total_indexing_buffer: 103887667,
    roles:{...},
    settings: {...},
    os: {
      refresh_interval_in_millis: 1000,
      name: "Linux",
      arch: "amd64",
      version: "3.10.0-229.el7.x86_64",
      available_processors: 4,
      allocated_processors: 4
    },
    process: {
      refresh_interval_in_millis: 1000,
      id: 3022,
      mlockall: false
    },
    jvm: {
      pid: 3022,
      version: "1.8.0_121",
      vm_name: "Java HotSpot(TM) 64-Bit Server VM",
      vm_version: "25.121-b13",
      vm_vendor: "Oracle Corporation",
      start_time_in_millis: 1507515225302,
      mem: {
      heap_init_in_bytes: 1073741824,
      heap_max_in_bytes: 1038876672,
      non_heap_init_in_bytes: 2555904,
      non_heap_max_in_bytes: 0,
      direct_max_in_bytes: 1038876672
      },
      gc_collectors: [],
      memory_pools: [],
      using_compressed_ordinary_object_pointers: "true",
      input_arguments:{}
    }
    thread_pool:{
      force_merge: {},
      fetch_shard_started: {},
      listener: {},
      index: {},
      refresh: {},
      generic: {},
      warmer: {},
      search: {},
      flush: {},
      fetch_shard_store: {},
      management: {},
      get: {},
      bulk: {},
      snapshot: {}
    }
    transport: {...},
    http: {...},
    plugins: [],
    modules: [],
    ingest: {...}
 }

上面是我已经简写了很多数据之后的返回值,但是指标还是很多,有些是一些常规的指标,对于监控来说,没必要拿取。从上面我们可以主要关注以下这些指标:

os, process, jvm, thread_pool, transport, http, ingest and indices

节点统计     nodes-statistics

节点统计值 API 可通过如下命令获取:

GET /_nodes/stats

得到:

_nodes: {
  total: 2,
  successful: 2,
  failed: 0
},
cluster_name: "elasticsearch",
nodes: {
  MSQ_CZ7mTNyOSlYI0yvHag: {
    timestamp: 1508312932354,
    name: "node0",
    transport_address: "192.168.180.110:9300",
    host: "192.168.180.110",
    ip: "192.168.180.110:9300",
    roles: [],
    indices: {
      docs: {
           count: 6163666,
           deleted: 0
        },
      store: {
           size_in_bytes: 2301398179,
           throttle_time_in_millis: 122850
        },
      indexing: {},
      get: {},
      search: {},
      merges: {},
      refresh: {},
      flush: {},
      warmer: {},
      query_cache: {},
      fielddata: {},
      completion: {},
      segments: {},
      translog: {},
      request_cache: {},
      recovery: {}
  },
  os: {
    timestamp: 1508312932369,
    cpu: {
      percent: 0,
      load_average: {
        1m: 0.09,
        5m: 0.12,
        15m: 0.08
      }
    },
    mem: {
      total_in_bytes: 8358301696,
      free_in_bytes: 1381613568,
      used_in_bytes: 6976688128,
      free_percent: 17,
      used_percent: 83
    },
    swap: {
      total_in_bytes: 8455712768,
      free_in_bytes: 8455299072,
      used_in_bytes: 413696
    },
    cgroup: {
      cpuacct: {},
      cpu: {
        control_group: "/user.slice",
        cfs_period_micros: 100000,
        cfs_quota_micros: -1,
        stat: {}
      }
  }
},
process: {
  timestamp: 1508312932369,
  open_file_descriptors: 228,
  max_file_descriptors: 65536,
  cpu: {
    percent: 0,
    total_in_millis: 2495040
  },
  mem: {
    total_virtual_in_bytes: 5002465280
  }
},
jvm: {
  timestamp: 1508312932369,
  uptime_in_millis: 797735804,
  mem: {
    heap_used_in_bytes: 318233768,
    heap_used_percent: 30,
    heap_committed_in_bytes: 1038876672,
    heap_max_in_bytes: 1038876672,
    non_heap_used_in_bytes: 102379784,
    non_heap_committed_in_bytes: 108773376,
  pools: {
    young: {
      used_in_bytes: 62375176,
      max_in_bytes: 279183360,
      peak_used_in_bytes: 279183360,
      peak_max_in_bytes: 279183360
    },
    survivor: {
      used_in_bytes: 175384,
      max_in_bytes: 34865152,
      peak_used_in_bytes: 34865152,
      peak_max_in_bytes: 34865152
    },
    old: {
      used_in_bytes: 255683208,
      max_in_bytes: 724828160,
      peak_used_in_bytes: 255683208,
      peak_max_in_bytes: 724828160
    }
  }
  },
  threads: {},
  gc: {},
  buffer_pools: {},
  classes: {}
},
  thread_pool: {
    bulk: {},
    fetch_shard_started: {},
    fetch_shard_store: {},
    flush: {},
    force_merge: {},
    generic: {},
    get: {},
    index: {
       threads: 1,
       queue: 0,
       active: 0,
       rejected: 0,
       largest: 1,
       completed: 1
    }
    listener: {},
    management: {},
    refresh: {},
    search: {},
    snapshot: {},
    warmer: {}
  },
  fs: {},
  transport: {
    server_open: 13,
    rx_count: 11696,
    rx_size_in_bytes: 1525774,
    tx_count: 10282,
    tx_size_in_bytes: 1440101928
  },
  http: {
    current_open: 4,
    total_opened: 23
  },
  breakers: {},
  script: {},
  discovery: {},
  ingest: {}
}

节点名是一个 UUID,上面列举了很多指标,下面讲解下:

索引部分 indices

这部分列出了这个节点上所有索引的聚合过的统计值 :

  • docs 展示节点内存有多少文档,包括还没有从段里清除的已删除文档数量。

  • store 部分显示节点耗用了多少物理存储。这个指标包括主分片和副本分片在内。如果限流时间很大,那可能表明你的磁盘限流设置得过低。

  • indexing 显示已经索引了多少文档。这个值是一个累加计数器。在文档被删除的时候,数值不会下降。还要注意的是,在发生内部 索引操作的时候,这个值也会增加,比如说文档更新。

  还列出了索引操作耗费的时间,正在索引的文档数量,以及删除操作的类似统计值。

  • get 显示通过 ID 获取文档的接口相关的统计值。包括对单个文档的 GETHEAD 请求。

  • search 描述在活跃中的搜索( open_contexts )数量、查询的总数量、以及自节点启动以来在查询上消耗的总时间。用 query_time_in_millis / query_total 计算的比值,可以用来粗略的评价你的查询有多高效。比值越大,每个查询花费的时间越多,你应该要考虑调优了。

  fetch 统计值展示了查询处理的后一半流程(query-then-fetch 里的 fetch )。如果 fetch 耗时比 query 还多,说明磁盘较慢,或者获取了太多文档,或者可能搜索请求设置了太大的分页(比如, size: 10000 )。

  • merges 包括了 Lucene 段合并相关的信息。它会告诉你目前在运行几个合并,合并涉及的文档数量,正在合并的段的总大小,以及在合并操作上消耗的总时间。

  • filter_cache 展示了已缓存的过滤器位集合所用的内存数量,以及过滤器被驱逐出内存的次数。过多的驱逐数 可能 说明你需要加大过滤器缓存的大小,或者你的过滤器不太适合缓存(比如它们因为高基数而在大量产生,就像是缓存一个 now 时间表达式)。

  不过,驱逐数是一个很难评定的指标。过滤器是在每个段的基础上缓存的,而从一个小的段里驱逐过滤器,代价比从一个大的段里要廉价的多。有可能你有很大的驱逐数,但是它们都发生在小段上,也就意味着这些对查询性能只有很小的影响。

  把驱逐数指标作为一个粗略的参考。如果你看到数字很大,检查一下你的过滤器,确保他们都是正常缓存的。不断驱逐着的过滤器,哪怕都发生在很小的段上,效果也比正确缓存住了的过滤器差很多。

  • field_data 显示 fielddata 使用的内存, 用以聚合、排序等等。这里也有一个驱逐计数。和 filter_cache 不同的是,这里的驱逐计数是很有用的:这个数应该或者至少是接近于 0。因为 fielddata 不是缓存,任何驱逐都消耗巨大,应该避免掉。如果你在这里看到驱逐数,你需要重新评估你的内存情况,fielddata 限制,请求语句,或者这三者。

  • segments 会展示这个节点目前正在服务中的 Lucene 段的数量。 这是一个重要的数字。大多数索引会有大概 50–150 个段,哪怕它们存有 TB 级别的数十亿条文档。段数量过大表明合并出现了问题(比如,合并速度跟不上段的创建)。注意这个统计值是节点上所有索引的汇聚总数。记住这点。

  memory 统计值展示了 Lucene 段自己用掉的内存大小。 这里包括底层数据结构,比如倒排表,字典,和布隆过滤器等。太大的段数量会增加这些数据结构带来的开销,这个内存使用量就是一个方便用来衡量开销的度量值。

操作系统和进程部分

OSProcess 部分基本是自描述的,不会在细节中展开讲解。它们列出来基础的资源统计值,比如 CPU 和负载。OS 部分描述了整个操作系统,而 Process 部分只显示 Elasticsearch 的 JVM 进程使用的资源情况。

这些都是非常有用的指标,不过通常在你的监控技术栈里已经都测量好了。统计值包括下面这些:

  • CPU
  • 负载
  • 内存使用率 (mem.used_percent)
  • Swap 使用率
  • 打开的文件描述符 (open_file_descriptors)

JVM 部分

jvm 部分包括了运行 Elasticsearch 的 JVM 进程一些很关键的信息。 最重要的,它包括了垃圾回收的细节,这对你的 Elasticsearch 集群的稳定性有着重大影响。

jvm: {
  timestamp: 1508312932369,
  uptime_in_millis: 797735804,
  mem: {
    heap_used_in_bytes: 318233768,
    heap_used_percent: 30,
    heap_committed_in_bytes: 1038876672,
    heap_max_in_bytes: 1038876672,
    non_heap_used_in_bytes: 102379784,
    non_heap_committed_in_bytes: 108773376,
  }
}

jvm 部分首先列出一些和 heap 内存使用有关的常见统计值。你可以看到有多少 heap 被使用了,多少被指派了(当前被分配给进程的),以及 heap 被允许分配的最大值。理想情况下,heap_committed_in_bytes 应该等于 heap_max_in_bytes 。如果指派的大小更小,JVM 最终会被迫调整 heap 大小——这是一个非常昂贵的操作。如果你的数字不相等,阅读 堆内存:大小和交换 学习如何正确的配置它。

heap_used_percent 指标是值得关注的一个数字。Elasticsearch 被配置为当 heap 达到 75% 的时候开始 GC。如果你的节点一直 >= 75%,你的节点正处于 内存压力 状态。这是个危险信号,不远的未来可能就有慢 GC 要出现了。

如果 heap 使用率一直 >=85%,你就麻烦了。Heap 在 90–95% 之间,则面临可怕的性能风险,此时最好的情况是长达 10–30s 的 GC,最差的情况就是内存溢出(OOM)异常。

线程池部分

Elasticsearch 在内部维护了线程池。 这些线程池相互协作完成任务,有必要的话相互间还会传递任务。通常来说,你不需要配置或者调优线程池,不过查看它们的统计值有时候还是有用的,可以洞察你的集群表现如何。

每个线程池会列出已配置的线程数量( threads ),当前在处理任务的线程数量( active ),以及在队列中等待处理的任务单元数量( queue )。

如果队列中任务单元数达到了极限,新的任务单元会开始被拒绝,你会在 rejected 统计值上看到它反映出来。这通常是你的集群在某些资源上碰到瓶颈的信号。因为队列满意味着你的节点或集群在用最高速度运行,但依然跟不上工作的蜂拥而入。

这里的一系列的线程池,大多数你可以忽略,但是有一小部分还是值得关注的:

  • indexing    普通的索引请求的线程池
  • bulk    批量请求,和单条的索引请求不同的线程池
  • get     Get-by-ID 操作
  • search    所有的搜索和查询请求
  • merging   专用于管理 Lucene 合并的线程池

网络部分

  • transport 显示和 传输地址 相关的一些基础统计值。包括节点间的通信(通常是 9300 端口)以及任意传输客户端或者节点客户端的连接。如果看到这里有很多连接数不要担心;Elasticsearch 在节点之间维护了大量的连接。
  • http 显示 HTTP 端口(通常是 9200)的统计值。如果你看到 total_opened 数很大而且还在一直上涨,这是一个明确信号,说明你的 HTTP 客户端里有没启用 keep-alive 长连接的。持续的 keep-alive 长连接对性能很重要,因为连接、断开套接字是很昂贵的(而且浪费文件描述符)。请确认你的客户端都配置正确。

参考资料

1、nodes-info

2、nodes-stats

3、ES监控指标

最后:

转载请注明地址:http://www.54tianzhisheng.cn/2017/10/18/ElasticSearch-nodes-metrics/

一个仿Linux 控制台的ES的_cat的插件

开源项目psfu 发表了文章 • 3 个评论 • 2669 次浏览 • 2017-10-16 10:31 • 来自相关话题

00-console.png
  • 简化_cat使用,可以直接输入 cat 命令 ,可以滚动查看历史结果
  • 支持字体放大缩小
  • 支持命令历史记录(通过上下方向键来切换 )
  • 支持鼠标划取的复制粘贴(暂不复制到剪贴板)
  • 安装后在 http://127.0.0.1:9200/_console  使用,也可本地使用:直接访问html文件
  GIT 地址   欢迎加 576037940 这个群讨论哈  
00-console.png
  • 简化_cat使用,可以直接输入 cat 命令 ,可以滚动查看历史结果
  • 支持字体放大缩小
  • 支持命令历史记录(通过上下方向键来切换 )
  • 支持鼠标划取的复制粘贴(暂不复制到剪贴板)
  • 安装后在 http://127.0.0.1:9200/_console  使用,也可本地使用:直接访问html文件
  GIT 地址   欢迎加 576037940 这个群讨论哈