

ES数据没了?谁动了我的数据?
背景
我们在使用 Elasticsearch 的时候,可能会遇到数据“丢”了的情况。有可能是数据没成功写入 ES 集群,也可能是数据被误删了。
针对数据被误删,有没有好的解决办法呢?
其实我们可以把“删除数据”这个操作管理起来。当 ES 集群接收到删除数据命令的时候,先不执行该命令,而是生成一条删除数据的记录,经过管理人员批准后,该命令才会执行。这样不仅可以管理数据的删除,还可以进行删除操作的追踪:什么人,什么时间,发送了什么样的删除指令,从哪个 IP 发送的,以什么身份登录的等等。
要实现这个解决办法,我们可借助 INFINI Gateway 和 Console 的帮助。
方案架构

方案效果
- INFINI Gateway 作为 ES 集群的代理,接收所有请求
- INFINI Gateway 对删除数据操作进行拦截,在 Console UI 界面生成记录
- 管理人员 在 Console UI 界面审批操作记录,审批通过操作被执行
方案演示
测试数据准备
测试索引 test1,一共有 3 条数据。message 内容分别是"line 1","line 2"和"line 3"。

启动 INFINI Gateway 及 Console
网关配置新增内容
增加对 DELETE 操作的捕获,不直接执行,写入队列中。后续由队列生成特定的记录。
router:
  - name: my_router
    default_flow: default_flow
    tracing_flow: logging_flow
    rules:
      - method:
          - "DELETE"
        pattern:
          - "/{any_index}"
          - "/{any_index}/{any_type}"
          - "/{any_index}/{any_type}/{any_docid}"
        flow:
          - audit_flow
      - method:
          - "*"
        pattern:
          - "/{any_index}/_delete_by_query"
          - "/_delete_by_query"
        flow:
          - audit_flow
flow:
  - name: audit_flow
    filter:
      - logging:
          queue_name: del_queue
pipeline:
  - name: del_queue_ingest
    auto_start: true
    keep_running: true
    processor:
      - json_indexing:
          input_queue: "del_queue"
          idle_timeout_in_seconds: 1
          elasticsearch: "logging-server"
          index_name: "del_requests"
          worker_size: 1
          bulk_size_in_kb: 1
执行删除操作
ES 支持多种删除操作,简单总结归纳如下:
- 删除指定文档 id
- 删除索引
- 根据查询删除指定数据(_delete_by_query)
执行删除操作之前,先通过 INFINI Gateway 访问 ES 集群,证明可正常访问数据。
 执行上述的几种删除命令,注意要发给 INFINI Gateway 的 8000 端口。

数据查询验证数据还在

Console 界面查看未批准的删除记录

所有删除操作,都被记录,待审批
Console 界面进行审批通过

选择一条记录,批准执行。Operation-approve
数据查询验证数据
"message": "line 2"的文档已被删除。

Console 界面查看历史记录

继续批准测试
批准删除一条文档


"message": "line 1" 的文档不在了。
批准删除索引


索引不在了。
至此我们演示了如何利用 INFINI Gateway 和 Console 对 ES 集群删除操作进行管控,本文只是抛砖引玉,相信还有更多有意思的场景等待大家发掘。
背景
我们在使用 Elasticsearch 的时候,可能会遇到数据“丢”了的情况。有可能是数据没成功写入 ES 集群,也可能是数据被误删了。
针对数据被误删,有没有好的解决办法呢?
其实我们可以把“删除数据”这个操作管理起来。当 ES 集群接收到删除数据命令的时候,先不执行该命令,而是生成一条删除数据的记录,经过管理人员批准后,该命令才会执行。这样不仅可以管理数据的删除,还可以进行删除操作的追踪:什么人,什么时间,发送了什么样的删除指令,从哪个 IP 发送的,以什么身份登录的等等。
要实现这个解决办法,我们可借助 INFINI Gateway 和 Console 的帮助。
方案架构
方案效果
- INFINI Gateway 作为 ES 集群的代理,接收所有请求
- INFINI Gateway 对删除数据操作进行拦截,在 Console UI 界面生成记录
- 管理人员 在 Console UI 界面审批操作记录,审批通过操作被执行
方案演示
测试数据准备
测试索引 test1,一共有 3 条数据。message 内容分别是"line 1","line 2"和"line 3"。
启动 INFINI Gateway 及 Console
网关配置新增内容
增加对 DELETE 操作的捕获,不直接执行,写入队列中。后续由队列生成特定的记录。
router:
  - name: my_router
    default_flow: default_flow
    tracing_flow: logging_flow
    rules:
      - method:
          - "DELETE"
        pattern:
          - "/{any_index}"
          - "/{any_index}/{any_type}"
          - "/{any_index}/{any_type}/{any_docid}"
        flow:
          - audit_flow
      - method:
          - "*"
        pattern:
          - "/{any_index}/_delete_by_query"
          - "/_delete_by_query"
        flow:
          - audit_flow
flow:
  - name: audit_flow
    filter:
      - logging:
          queue_name: del_queue
pipeline:
  - name: del_queue_ingest
    auto_start: true
    keep_running: true
    processor:
      - json_indexing:
          input_queue: "del_queue"
          idle_timeout_in_seconds: 1
          elasticsearch: "logging-server"
          index_name: "del_requests"
          worker_size: 1
          bulk_size_in_kb: 1
执行删除操作
ES 支持多种删除操作,简单总结归纳如下:
- 删除指定文档 id
- 删除索引
- 根据查询删除指定数据(_delete_by_query)
执行删除操作之前,先通过 INFINI Gateway 访问 ES 集群,证明可正常访问数据。
执行上述的几种删除命令,注意要发给 INFINI Gateway 的 8000 端口。
数据查询验证数据还在
Console 界面查看未批准的删除记录
所有删除操作,都被记录,待审批
Console 界面进行审批通过
选择一条记录,批准执行。Operation-approve
数据查询验证数据
"message": "line 2"的文档已被删除。
Console 界面查看历史记录
继续批准测试
批准删除一条文档
"message": "line 1" 的文档不在了。
批准删除索引
索引不在了。
至此我们演示了如何利用 INFINI Gateway 和 Console 对 ES 集群删除操作进行管控,本文只是抛砖引玉,相信还有更多有意思的场景等待大家发掘。
收起阅读 »社区日报 第1626期 (2023-05-12)
1、使用 Prometheus 进行 Elasticsearch 监控的主要指标
https://sysdig.com/blog/elasticsearch-monitoring/
2、使用 Elasticsearch、OpenAI 和 LangChain 进行语义搜索
https://dylancastillo.co/seman ... hain/
3、elastic4s – Elasticsearch Scala 客户端
https://www.baeldung.com/scala ... lient
编辑:铭毅天下
归档:https://ela.st/cn-daily-all
订阅:https://ela.st/cn-daily-sub
沙龙:https://ela.st/cn-meetup
B站: https://ela.st/bilibili
收起阅读 »
社区日报 第1625期 (2023-05-11)
https://articlebyjashan.medium ... f1e6e
2.使用 KubeDB 在 Kubernetes 集群中部署 OpenSearch(需要梯子)
https://medium.com/appscode/si ... 047bd
3.实时数据摄取管道:企业入门指南(需要梯子)
https://medium.com/plumbersofd ... cc475
编辑:Se7en
归档:https://ela.st/cn-daily-all
订阅:https://ela.st/cn-daily-sub
沙龙:https://ela.st/cn-meetup
B站: https://ela.st/bilibili
https://articlebyjashan.medium ... f1e6e
2.使用 KubeDB 在 Kubernetes 集群中部署 OpenSearch(需要梯子)
https://medium.com/appscode/si ... 047bd
3.实时数据摄取管道:企业入门指南(需要梯子)
https://medium.com/plumbersofd ... cc475
编辑:Se7en
归档:https://ela.st/cn-daily-all
订阅:https://ela.st/cn-daily-sub
沙龙:https://ela.st/cn-meetup
B站: https://ela.st/bilibili 收起阅读 »
助力 Elasticsearch 国产化,极限科技受邀参加 2023 移动云大会
近日,2023 移动云大会“数据库&云原生创新”论坛 在苏州隆重召开。现场精英荟萃、专家云集,共同探讨数据库与云原生技术发展及应用落地方案,为助力推动云原生数据库产业发展建言献策。极限科技创始人兼 CEO 曾勇受邀出席论坛。

会上,极限科技创始人兼 CEO 曾勇针对《Elasticsearch 国产化在移动云的演进之路》主题进行演讲,演讲围绕了什么是 Elasticsearch 以及 Elasticsearch 在移动云上的国产化演进过程。
Elasticsearch 在移动云的演进
随着数字化转型的不断深化,非结构化数据日益成为各类组织数据的增长主力,但其在管理和应用方面仍面临模态多样、管理复杂、检索挖掘难度大等挑战。为此,极限科技与移动云共同研发出搜索型数据库软件 Easysearch。
“Easysearch” 是极限科技在 Elasticsearch 软件原版本基础上,立足中国企业需求,助力移动云打造更符合其需求,独具 8 大特色功能的自有开源平替版本系统。-- 极限科技创始人兼 CEO 曾勇在会上介绍道
移动云版本 “Easysearch” 精简 Kernel ,只保留开源核心能力,回归轻量化;增强内核后,可更稳定可靠地支持万亿级数据规模;为进一步增强安全能力,系统支持字段内容脱敏的同时对字段级别采取权限控制;可降低灾难恢复时间,系统具备完整的备份与容灾能力,可实时切换;为更好地服务业务场景,此版本更关注搜索场景的优化;增强型中文分词,提供本地化的词库与拼音支持;增强数据压缩能力后,最高可降低 40%存储空间;信创兼容的系统,支持适配国产操作系统和 CPU 芯片。
目前 Elasticsearch 为移动云提供的后端架构,已由基于 Docker 容器的“移动云 ES v1.0”升级为基于 K8s 架构的“移动云 ES v2.0”版本。其优势可以体现在:
- 新版本更具自主可控性,应对新需求更具灵活性;
- 基于 K8s 架构的系统,能支持更大规模的集群服务;
- 在支持全链路 IPv6 和本地磁盘(IO 隔离)的基础上,实现了更优性能的升级。

Elasticsearch 在中国已有近十万+开发者,上万家企业已经在生产环境大规模运行 Elasticsearch,服务客户包括知名互联网公司及大型企事业单位,覆盖全国范围内生活消费、金融投资、娱乐学习、软件应用与安全等领域知名企业。-- 极限科技创始人兼 CEO 曾勇在会上介绍道
极限科技创始成员多来自 Elasticsearch 中国团队,深耕搜索及 Elasticsearch 十多年,且运营有国内最大的开源搜索技术社区,极限科技团队具备雄厚的技术实力和丰富的相关行业经验技术积累。
国产化替代的首选方案“Easysearch”
目前实时大数据搜索分析,尤其是结构化和非结构化数据结合的场景和需求非常大。针对海量数据,搜索技术成为核心,大多数企业都有不止部署一套搜索后端服务来满足各个场景的搜索业务需求。-- 极限科技创始人兼 CEO 曾勇在会上介绍道
Easysearch 的目标是提供一个轻量级的 Elasticsearch 可替代版本,并继续完善和支持更多的企业级功能。该软件衍生自开源的搜索引擎软件 Elasticsearch,具备相当的接口兼容能力,对于目前国内广大的 Elasticsearch 用户来说切换和接入的成本非常低。
与 Elasticsearch 相比,Easysearch 更关注在搜索业务场景的优化和继续保持其产品的简洁与易用性。基于团队在搜索和 Elasticsearch 生态的多年深耕,极限科技已具备完全自主自研可控能力,Easysearch 因更符合国产搜索技术生态需求,目前逐渐成为 Elasticsearch 国产化替代的首选方案。
作为一款具备自主可控的分布式近实时搜索型数据库产品 Easysearch 具备高性能、高可用、弹性伸缩、高安全性等特性,支持丰富的个性化搜索及聚合分析,且能承载 PB 级别的海量业务数据,可部署在物理机、虚拟机、容器、私有云和公有云,为金融核心系统、运营商、制造业和政企业务系统提供安全、稳定、可靠的快速检索和实时数据探索分析能力,满足不同业务场景的各项复杂需求。
持续丰富完善企业级服务能力
随着国内搜索型数据库的迅速发展,关键技术逐渐突破,应用场景和数据规模也逐年上升,已经成为企业必不可少的核心基础设施,产业生态日益繁荣。
截至目前,极限科技与移动云合作共建的 Easysearch 系统,已在无锡、呼和浩特、南基这 3 个城市上线,此外还有北京、上海、重庆、宁波、海南等 9 个城市的资源池正在上线中。-- 极限科技创始人兼 CEO 曾勇介绍道。
作为全球领先的近实时搜索数据库技术提供商,极限科技始终致力于搜索核心技术的研发与创新,基于国内搜索型数据库行业生态需求,在产品研发创新上,着力提升产品易用性、实时性、降低 IT 成本等,为推动国内搜索行业技术水平及相关技术社区的发展,建设数据强国提供强有力的基础技术支撑。
极限科技自成立起始终致力于提供本地化配套产品及解决方案,帮助客户解决在使用 Elasticsearch 时遇到的各种挑战。未来,极限科技将基于更多的真实客户场景提供个性化服务,持续丰富并完善更多维度、更高需求的企业级服务能力,与移动云等众多行业平台一起构建更“简单”的搜索服务。
关于极限科技

极限科技,全称极限数据(北京)科技有限公司,是一家专注于实时搜索与数据分析的软件公司。旗下品牌极限实验室(INFINI Labs)致力于打造极致易用的数据探索与分析体验。让搜索更简单是我们追求的目标。
极限科技是一支年轻的团队,采用天然分布式的方式来进行远程协作,员工分布在全球各地,希望通过努力成为中国乃至全球企业大数据实时搜索分析产品的首选,为中国技术品牌输出添砖加瓦。
更多详情参见官网 (https://infinilabs.com) 。
近日,2023 移动云大会“数据库&云原生创新”论坛 在苏州隆重召开。现场精英荟萃、专家云集,共同探讨数据库与云原生技术发展及应用落地方案,为助力推动云原生数据库产业发展建言献策。极限科技创始人兼 CEO 曾勇受邀出席论坛。
会上,极限科技创始人兼 CEO 曾勇针对《Elasticsearch 国产化在移动云的演进之路》主题进行演讲,演讲围绕了什么是 Elasticsearch 以及 Elasticsearch 在移动云上的国产化演进过程。
Elasticsearch 在移动云的演进
随着数字化转型的不断深化,非结构化数据日益成为各类组织数据的增长主力,但其在管理和应用方面仍面临模态多样、管理复杂、检索挖掘难度大等挑战。为此,极限科技与移动云共同研发出搜索型数据库软件 Easysearch。
“Easysearch” 是极限科技在 Elasticsearch 软件原版本基础上,立足中国企业需求,助力移动云打造更符合其需求,独具 8 大特色功能的自有开源平替版本系统。-- 极限科技创始人兼 CEO 曾勇在会上介绍道
移动云版本 “Easysearch” 精简 Kernel ,只保留开源核心能力,回归轻量化;增强内核后,可更稳定可靠地支持万亿级数据规模;为进一步增强安全能力,系统支持字段内容脱敏的同时对字段级别采取权限控制;可降低灾难恢复时间,系统具备完整的备份与容灾能力,可实时切换;为更好地服务业务场景,此版本更关注搜索场景的优化;增强型中文分词,提供本地化的词库与拼音支持;增强数据压缩能力后,最高可降低 40%存储空间;信创兼容的系统,支持适配国产操作系统和 CPU 芯片。
目前 Elasticsearch 为移动云提供的后端架构,已由基于 Docker 容器的“移动云 ES v1.0”升级为基于 K8s 架构的“移动云 ES v2.0”版本。其优势可以体现在:
- 新版本更具自主可控性,应对新需求更具灵活性;
- 基于 K8s 架构的系统,能支持更大规模的集群服务;
- 在支持全链路 IPv6 和本地磁盘(IO 隔离)的基础上,实现了更优性能的升级。
Elasticsearch 在中国已有近十万+开发者,上万家企业已经在生产环境大规模运行 Elasticsearch,服务客户包括知名互联网公司及大型企事业单位,覆盖全国范围内生活消费、金融投资、娱乐学习、软件应用与安全等领域知名企业。-- 极限科技创始人兼 CEO 曾勇在会上介绍道
极限科技创始成员多来自 Elasticsearch 中国团队,深耕搜索及 Elasticsearch 十多年,且运营有国内最大的开源搜索技术社区,极限科技团队具备雄厚的技术实力和丰富的相关行业经验技术积累。
国产化替代的首选方案“Easysearch”
目前实时大数据搜索分析,尤其是结构化和非结构化数据结合的场景和需求非常大。针对海量数据,搜索技术成为核心,大多数企业都有不止部署一套搜索后端服务来满足各个场景的搜索业务需求。-- 极限科技创始人兼 CEO 曾勇在会上介绍道
Easysearch 的目标是提供一个轻量级的 Elasticsearch 可替代版本,并继续完善和支持更多的企业级功能。该软件衍生自开源的搜索引擎软件 Elasticsearch,具备相当的接口兼容能力,对于目前国内广大的 Elasticsearch 用户来说切换和接入的成本非常低。
与 Elasticsearch 相比,Easysearch 更关注在搜索业务场景的优化和继续保持其产品的简洁与易用性。基于团队在搜索和 Elasticsearch 生态的多年深耕,极限科技已具备完全自主自研可控能力,Easysearch 因更符合国产搜索技术生态需求,目前逐渐成为 Elasticsearch 国产化替代的首选方案。
作为一款具备自主可控的分布式近实时搜索型数据库产品 Easysearch 具备高性能、高可用、弹性伸缩、高安全性等特性,支持丰富的个性化搜索及聚合分析,且能承载 PB 级别的海量业务数据,可部署在物理机、虚拟机、容器、私有云和公有云,为金融核心系统、运营商、制造业和政企业务系统提供安全、稳定、可靠的快速检索和实时数据探索分析能力,满足不同业务场景的各项复杂需求。
持续丰富完善企业级服务能力
随着国内搜索型数据库的迅速发展,关键技术逐渐突破,应用场景和数据规模也逐年上升,已经成为企业必不可少的核心基础设施,产业生态日益繁荣。
截至目前,极限科技与移动云合作共建的 Easysearch 系统,已在无锡、呼和浩特、南基这 3 个城市上线,此外还有北京、上海、重庆、宁波、海南等 9 个城市的资源池正在上线中。-- 极限科技创始人兼 CEO 曾勇介绍道。
作为全球领先的近实时搜索数据库技术提供商,极限科技始终致力于搜索核心技术的研发与创新,基于国内搜索型数据库行业生态需求,在产品研发创新上,着力提升产品易用性、实时性、降低 IT 成本等,为推动国内搜索行业技术水平及相关技术社区的发展,建设数据强国提供强有力的基础技术支撑。
极限科技自成立起始终致力于提供本地化配套产品及解决方案,帮助客户解决在使用 Elasticsearch 时遇到的各种挑战。未来,极限科技将基于更多的真实客户场景提供个性化服务,持续丰富并完善更多维度、更高需求的企业级服务能力,与移动云等众多行业平台一起构建更“简单”的搜索服务。
关于极限科技
极限科技,全称极限数据(北京)科技有限公司,是一家专注于实时搜索与数据分析的软件公司。旗下品牌极限实验室(INFINI Labs)致力于打造极致易用的数据探索与分析体验。让搜索更简单是我们追求的目标。
极限科技是一支年轻的团队,采用天然分布式的方式来进行远程协作,员工分布在全球各地,希望通过努力成为中国乃至全球企业大数据实时搜索分析产品的首选,为中国技术品牌输出添砖加瓦。
更多详情参见官网 (https://infinilabs.com) 。
收起阅读 »社区日报 第1624期 (2023-05-10)
https://www.elastic.co/cn/blog ... emory
2.Elasticsearch 缓存深度剖析:一次提高一种缓存的查询速度
https://www.elastic.co/cn/blog ... -time
3.Elasticsearch:结合两全其美:Elasticsearch 与 BM25 和 HNSW 的混合搜索
https://elasticstack.blog.csdn ... 39041
编辑:kin122
归档:https://ela.st/cn-daily-all
订阅:https://ela.st/cn-daily-sub
沙龙:https://ela.st/cn-meetup
B站:https://ela.st/bilibili
https://www.elastic.co/cn/blog ... emory
2.Elasticsearch 缓存深度剖析:一次提高一种缓存的查询速度
https://www.elastic.co/cn/blog ... -time
3.Elasticsearch:结合两全其美:Elasticsearch 与 BM25 和 HNSW 的混合搜索
https://elasticstack.blog.csdn ... 39041
编辑:kin122
归档:https://ela.st/cn-daily-all
订阅:https://ela.st/cn-daily-sub
沙龙:https://ela.st/cn-meetup
B站:https://ela.st/bilibili 收起阅读 »
社区日报 第1623期 (2023-05-09)
1. ES 知识点串讲(1)集群、节点和索引(需要梯子)
https://braineanear.medium.com ... c1e2f
2. ES 知识点串讲(2)集群状态检查(需要梯子)
https://braineanear.medium.com ... 875c7
3. 想搞向量搜索吗兄弟,来看过来(需要梯子)
https://betterprogramming.pub/ ... 3dd9d
编辑:斯蒂文
归档:https://ela.st/cn-daily-all
订阅:https://ela.st/cn-daily-sub
沙龙:https://ela.st/cn-meetup
B站: https://ela.st/bilibili
社区:https://elasticsearch.cn/article/14882
1. ES 知识点串讲(1)集群、节点和索引(需要梯子)
https://braineanear.medium.com ... c1e2f
2. ES 知识点串讲(2)集群状态检查(需要梯子)
https://braineanear.medium.com ... 875c7
3. 想搞向量搜索吗兄弟,来看过来(需要梯子)
https://betterprogramming.pub/ ... 3dd9d
编辑:斯蒂文
归档:https://ela.st/cn-daily-all
订阅:https://ela.st/cn-daily-sub
沙龙:https://ela.st/cn-meetup
B站: https://ela.st/bilibili
社区:https://elasticsearch.cn/article/14882 收起阅读 »
社区日报 第1623期 (2023-05-09)
https://braineanear.medium.com ... c1e2f
2. ES 知识点串讲(2)集群状态检查(需要梯子)
https://braineanear.medium.com ... 875c7
3. 想搞向量搜索吗兄弟,来看过来(需要梯子)
https://betterprogramming.pub/ ... 3dd9d
编辑:斯蒂文
归档:https://ela.st/cn-daily-all
订阅:https://ela.st/cn-daily-sub
沙龙:https://ela.st/cn-meetup
B站: https://ela.st/bilibili
https://braineanear.medium.com ... c1e2f
2. ES 知识点串讲(2)集群状态检查(需要梯子)
https://braineanear.medium.com ... 875c7
3. 想搞向量搜索吗兄弟,来看过来(需要梯子)
https://betterprogramming.pub/ ... 3dd9d
编辑:斯蒂文
归档:https://ela.st/cn-daily-all
订阅:https://ela.st/cn-daily-sub
沙龙:https://ela.st/cn-meetup
B站: https://ela.st/bilibili
收起阅读 »
社区日报 第1622期 (2023-05-08)
https://blog.csdn.net/qq_26870 ... 09398
2. 开放搜索兼容Elasticsearch做召回引擎
https://developer.aliyun.com/a ... 16271
3. Elasticsearch 如何构建一个好的电商搜索引擎
https://mp.weixin.qq.com/s/eLhPMI38miBWlWxuMPv-2A
编辑:yuebancanghai
归档:https://ela.st/cn-daily-all
订阅:https://ela.st/cn-daily-sub
沙龙:https://ela.st/cn-meetup
B站:https://ela.st/bilibili
https://blog.csdn.net/qq_26870 ... 09398
2. 开放搜索兼容Elasticsearch做召回引擎
https://developer.aliyun.com/a ... 16271
3. Elasticsearch 如何构建一个好的电商搜索引擎
https://mp.weixin.qq.com/s/eLhPMI38miBWlWxuMPv-2A
编辑:yuebancanghai
归档:https://ela.st/cn-daily-all
订阅:https://ela.st/cn-daily-sub
沙龙:https://ela.st/cn-meetup
B站:https://ela.st/bilibili 收起阅读 »
国内首家 | 极限科技率先完成信通院搜索型数据库行业标准测试
随着数字化转型的深入,非结构化数据越来越多地出现在各种类型的数据中,成为了最主要的数据元素,其中蕴藏着巨大的价值。根据 IDC 的预测,到 2025 年,非结构化的数据将占到 80%,而高德纳公司的预测,到 2024 年,这一数字将会是现在的三倍。当前,非结构化数据存在表征多样、管理复杂、价值挖掘困难等问题,而基于自动分词、倒排索引、关联度计算、矢量检索等技术的检索数据库,是实现非结构化数据高效处理的基本工具,自 90 年代产生至今,一直在发展和演变,已成为数据库研究的一个重要分支。
顺利完成首个搜索型数据库产品能力测试
《搜索型数据库技术要求》是中国信通院云计算与大数据研究所依托中国通信标准化协会大数据技术标准推进委员会(CCSA TC601)和中国信通院数据库应用创新实验室(CAICT DBL),联合阿里云、拓尔思、极限科技、星环科技、科大讯飞、百度、联通软研院等多家企业专家参与编制,融合国内行业专家丰富的实践经验与智慧,对搜索型数据库基础能力进行综合评判的行业权威标准。
2023 年 4 月 18 日,在中国信通院组织的第一批“搜索型数据库”产品能力评测中,极限数据 (北京) 科技有限公司(以下简称:极限科技)的 INFINI Easysearch 搜索型数据库软件【Easysearch】顺利完成了首个搜索型数据库产品能力测试。该测评依据《搜索型数据库技术要求》进行,该标准融合了国内行业专家丰富的实践经验与智慧,是对搜索型数据库基础能力的综合评判,覆盖数据库基本能力、数据库管理能力、数据库安全能力、数据库兼容能力、数据库扩展能力、数据库高可用能力,共计 32 个测试项目,包括 12 个必选项和 20 个可选项。

搜索型数据库在各行业的重要应用
1.金融行业:搜索型数据库可以帮助金融机构快速检索和分析海量的客户交易数据,预测市场趋势、评估客户风险、优化交易策略等。
2.通信行业:搜索型数据库可以帮助运营商管理和分析海量的网络数据,例如网络流量、网络性能、用户活跃度等,从而提高网络效率和用户体验。
3.制造业:搜索型数据库可以帮助制造企业高效管理和分析海量的生产数据,例如生产效率产品质量、供应链信息等,从而提高生产效率和产品质量。
4.零售行业:搜索型数据库可以帮助零售商快速检索和分析海量的销售数据,例如顾客购买记录、商品销售趋势、促销活动效果等,从而更好地制定营销策略、优化商品库存管理、提高销售业绩等。
5.医疗行业:搜索型数据库可以帮助医疗机构快速检索和分析海量的医疗数据,例如患者病历、医学论文、药品说明书等,从而更好地研究疾病、制定治疗方案、优化医疗资源等。
6.教育行业:搜索型数据库可以帮助教育机构快速检索和分析海量的教学数据,例如学生成绩、课程评价、教师绩效等,从而更好地优化教学策略、提高教学质量等。
INFINI Easysearch
极限科技研发的 INFINI Easysearch,是一款具备自主可控的分布式近实时搜索型数据库产品,具备高性能、高可用、弹性伸缩、高安全性等特性,具备支持丰富的个性化搜索及聚合分析能力,可部署在物理机、虚拟机、容器、私有云和公有云,能承载 PB 级别的海量业务数据,为金融核心系统、运营商、制造业和政企业务系统提供安全、稳定、可靠的快速检索和实时数据探索分析能力,可满足不同业务场景的各项复杂需求。

除了 Easysearch,极限科技还提供用于构建企业搜索基础设施的完整解决方案,通过云原生的方式来让企业高效治理大规模搜索集群,将分散的各个业务搜索计算资源合并归拢,通过资源统一调度管控,提升整体资源利用率和系统弹性,降低系统复杂度和 IT 运营成本,来持续满足业务的灵活多变需求,结合统一的安全、监控、告警、运维和管理等能力,达到统一管理、统一治理,降本增效,实现企业的搜索基础设施的平台化运营。

国内搜索型数据库最近几年发展迅速,关键技术逐渐突破,应用场景和数据规模也逐年上升,已经成为企业必不可少的核心基础设施,产业生态也日益繁荣。极限科技作为国内搜索型数据库产品厂商第一梯队的杰出代表,同时也是行业标准的起草单位之一,此次测试的成功通过,不仅代表着对 INFINI Easysearch 搜索型数据库软件 Easysearch 的权威性肯定,更代表着极限科技在“搜索数据库”产品的研究与创新上,取得了新的里程碑。
关于极限科技
极限科技,全称极限数据(北京)科技有限公司,是一家专注于实时搜索与数据分析的软件公司。旗下品牌极限实验室(INFINI Labs)致力于打造极致易用的数据探索与分析体验。让搜索更简单是我们追求的目标。
极限科技是一支年轻的团队,采用天然分布式的方式来进行远程协作,员工分布在全球各地,希望通过努力成为中国乃至全球企业大数据实时搜索分析产品的首选,为中国技术品牌输出添砖加瓦。
更多详情参见官网 (https://infinilabs.com) 。
相关链接
随着数字化转型的深入,非结构化数据越来越多地出现在各种类型的数据中,成为了最主要的数据元素,其中蕴藏着巨大的价值。根据 IDC 的预测,到 2025 年,非结构化的数据将占到 80%,而高德纳公司的预测,到 2024 年,这一数字将会是现在的三倍。当前,非结构化数据存在表征多样、管理复杂、价值挖掘困难等问题,而基于自动分词、倒排索引、关联度计算、矢量检索等技术的检索数据库,是实现非结构化数据高效处理的基本工具,自 90 年代产生至今,一直在发展和演变,已成为数据库研究的一个重要分支。
顺利完成首个搜索型数据库产品能力测试
《搜索型数据库技术要求》是中国信通院云计算与大数据研究所依托中国通信标准化协会大数据技术标准推进委员会(CCSA TC601)和中国信通院数据库应用创新实验室(CAICT DBL),联合阿里云、拓尔思、极限科技、星环科技、科大讯飞、百度、联通软研院等多家企业专家参与编制,融合国内行业专家丰富的实践经验与智慧,对搜索型数据库基础能力进行综合评判的行业权威标准。
2023 年 4 月 18 日,在中国信通院组织的第一批“搜索型数据库”产品能力评测中,极限数据 (北京) 科技有限公司(以下简称:极限科技)的 INFINI Easysearch 搜索型数据库软件【Easysearch】顺利完成了首个搜索型数据库产品能力测试。该测评依据《搜索型数据库技术要求》进行,该标准融合了国内行业专家丰富的实践经验与智慧,是对搜索型数据库基础能力的综合评判,覆盖数据库基本能力、数据库管理能力、数据库安全能力、数据库兼容能力、数据库扩展能力、数据库高可用能力,共计 32 个测试项目,包括 12 个必选项和 20 个可选项。
搜索型数据库在各行业的重要应用
1.金融行业:搜索型数据库可以帮助金融机构快速检索和分析海量的客户交易数据,预测市场趋势、评估客户风险、优化交易策略等。
2.通信行业:搜索型数据库可以帮助运营商管理和分析海量的网络数据,例如网络流量、网络性能、用户活跃度等,从而提高网络效率和用户体验。
3.制造业:搜索型数据库可以帮助制造企业高效管理和分析海量的生产数据,例如生产效率产品质量、供应链信息等,从而提高生产效率和产品质量。
4.零售行业:搜索型数据库可以帮助零售商快速检索和分析海量的销售数据,例如顾客购买记录、商品销售趋势、促销活动效果等,从而更好地制定营销策略、优化商品库存管理、提高销售业绩等。
5.医疗行业:搜索型数据库可以帮助医疗机构快速检索和分析海量的医疗数据,例如患者病历、医学论文、药品说明书等,从而更好地研究疾病、制定治疗方案、优化医疗资源等。
6.教育行业:搜索型数据库可以帮助教育机构快速检索和分析海量的教学数据,例如学生成绩、课程评价、教师绩效等,从而更好地优化教学策略、提高教学质量等。
INFINI Easysearch
极限科技研发的 INFINI Easysearch,是一款具备自主可控的分布式近实时搜索型数据库产品,具备高性能、高可用、弹性伸缩、高安全性等特性,具备支持丰富的个性化搜索及聚合分析能力,可部署在物理机、虚拟机、容器、私有云和公有云,能承载 PB 级别的海量业务数据,为金融核心系统、运营商、制造业和政企业务系统提供安全、稳定、可靠的快速检索和实时数据探索分析能力,可满足不同业务场景的各项复杂需求。
除了 Easysearch,极限科技还提供用于构建企业搜索基础设施的完整解决方案,通过云原生的方式来让企业高效治理大规模搜索集群,将分散的各个业务搜索计算资源合并归拢,通过资源统一调度管控,提升整体资源利用率和系统弹性,降低系统复杂度和 IT 运营成本,来持续满足业务的灵活多变需求,结合统一的安全、监控、告警、运维和管理等能力,达到统一管理、统一治理,降本增效,实现企业的搜索基础设施的平台化运营。
国内搜索型数据库最近几年发展迅速,关键技术逐渐突破,应用场景和数据规模也逐年上升,已经成为企业必不可少的核心基础设施,产业生态也日益繁荣。极限科技作为国内搜索型数据库产品厂商第一梯队的杰出代表,同时也是行业标准的起草单位之一,此次测试的成功通过,不仅代表着对 INFINI Easysearch 搜索型数据库软件 Easysearch 的权威性肯定,更代表着极限科技在“搜索数据库”产品的研究与创新上,取得了新的里程碑。
关于极限科技
极限科技,全称极限数据(北京)科技有限公司,是一家专注于实时搜索与数据分析的软件公司。旗下品牌极限实验室(INFINI Labs)致力于打造极致易用的数据探索与分析体验。让搜索更简单是我们追求的目标。
极限科技是一支年轻的团队,采用天然分布式的方式来进行远程协作,员工分布在全球各地,希望通过努力成为中国乃至全球企业大数据实时搜索分析产品的首选,为中国技术品牌输出添砖加瓦。
更多详情参见官网 (https://infinilabs.com) 。
相关链接
收起阅读 »Elasticsearch:如何在 Elastic 中实现图片相似度搜索
原文: Elasticsearch:如何在 Elastic 中实现图片相似度搜索

在本文章,我们将了解如何通过几个步骤在 Elastic 中实施相似图像搜索。 开始设置应用程序环境,然后导入 NLP 模型,最后完成为你的图像集生成嵌入。
Elasticsearch:如何在 Elastic 中实现图片相似度搜索
如何设置环境
第一步是为你的应用程序设置环境。 一般要求包括:
- Git
- Python 3.9
- Docker
- 数百张图片
使用数百张图像以确保获得最佳效果非常重要。
转到工作文件夹并检查创建的存储库代码。 然后导航到存储库文件夹。
1.  git clone https://github.com/radoondas/flask-elastic-image-search.git
2.  cd flask-elastic-image-search
1.  $ git clone https://github.com/radoondas/flask-elastic-image-search.git
2.  Cloning into 'flask-elastic-image-search'...
3.  remote: Enumerating objects: 105, done.
4.  remote: Counting objects: 100% (105/105), done.
5.  remote: Compressing objects: 100% (72/72), done.
6.  remote: Total 105 (delta 37), reused 94 (delta 27), pack-reused 0
7.  Receiving objects: 100% (105/105), 20.72 MiB | 9.75 MiB/s, done.
8.  Resolving deltas: 100% (37/37), done.
9.  $ cd flask-elastic-image-search/
10.  $ pwd
11.  /Users/liuxg/python/flask-elastic-image-search
因为你将使用 Python 来运行代码,所以你需要确保满足所有要求并且环境已准备就绪。 现在创建虚拟环境并安装所有依赖项。
1.  python3 -m venv .venv
2.  source .venv/bin/activate
3.  pip install -r requirements.txt
安装
如果你还没有安装好自己的 Elasticsearch 及 Kibana,请参考如下的文章来进行安装:
特别注意的是:我们将以最新的 Elastic Stack 8.6.1 来进行展示。请参考 Elastic Stack 8.x 的文章进行安装。
启动白金版试用功能
由于上传模型是一个白金版的功能,我们需要启动试用功能。更多关于订阅的信息,请参考网址:订阅 | Elastic Stack 产品和支持 | Elastic。
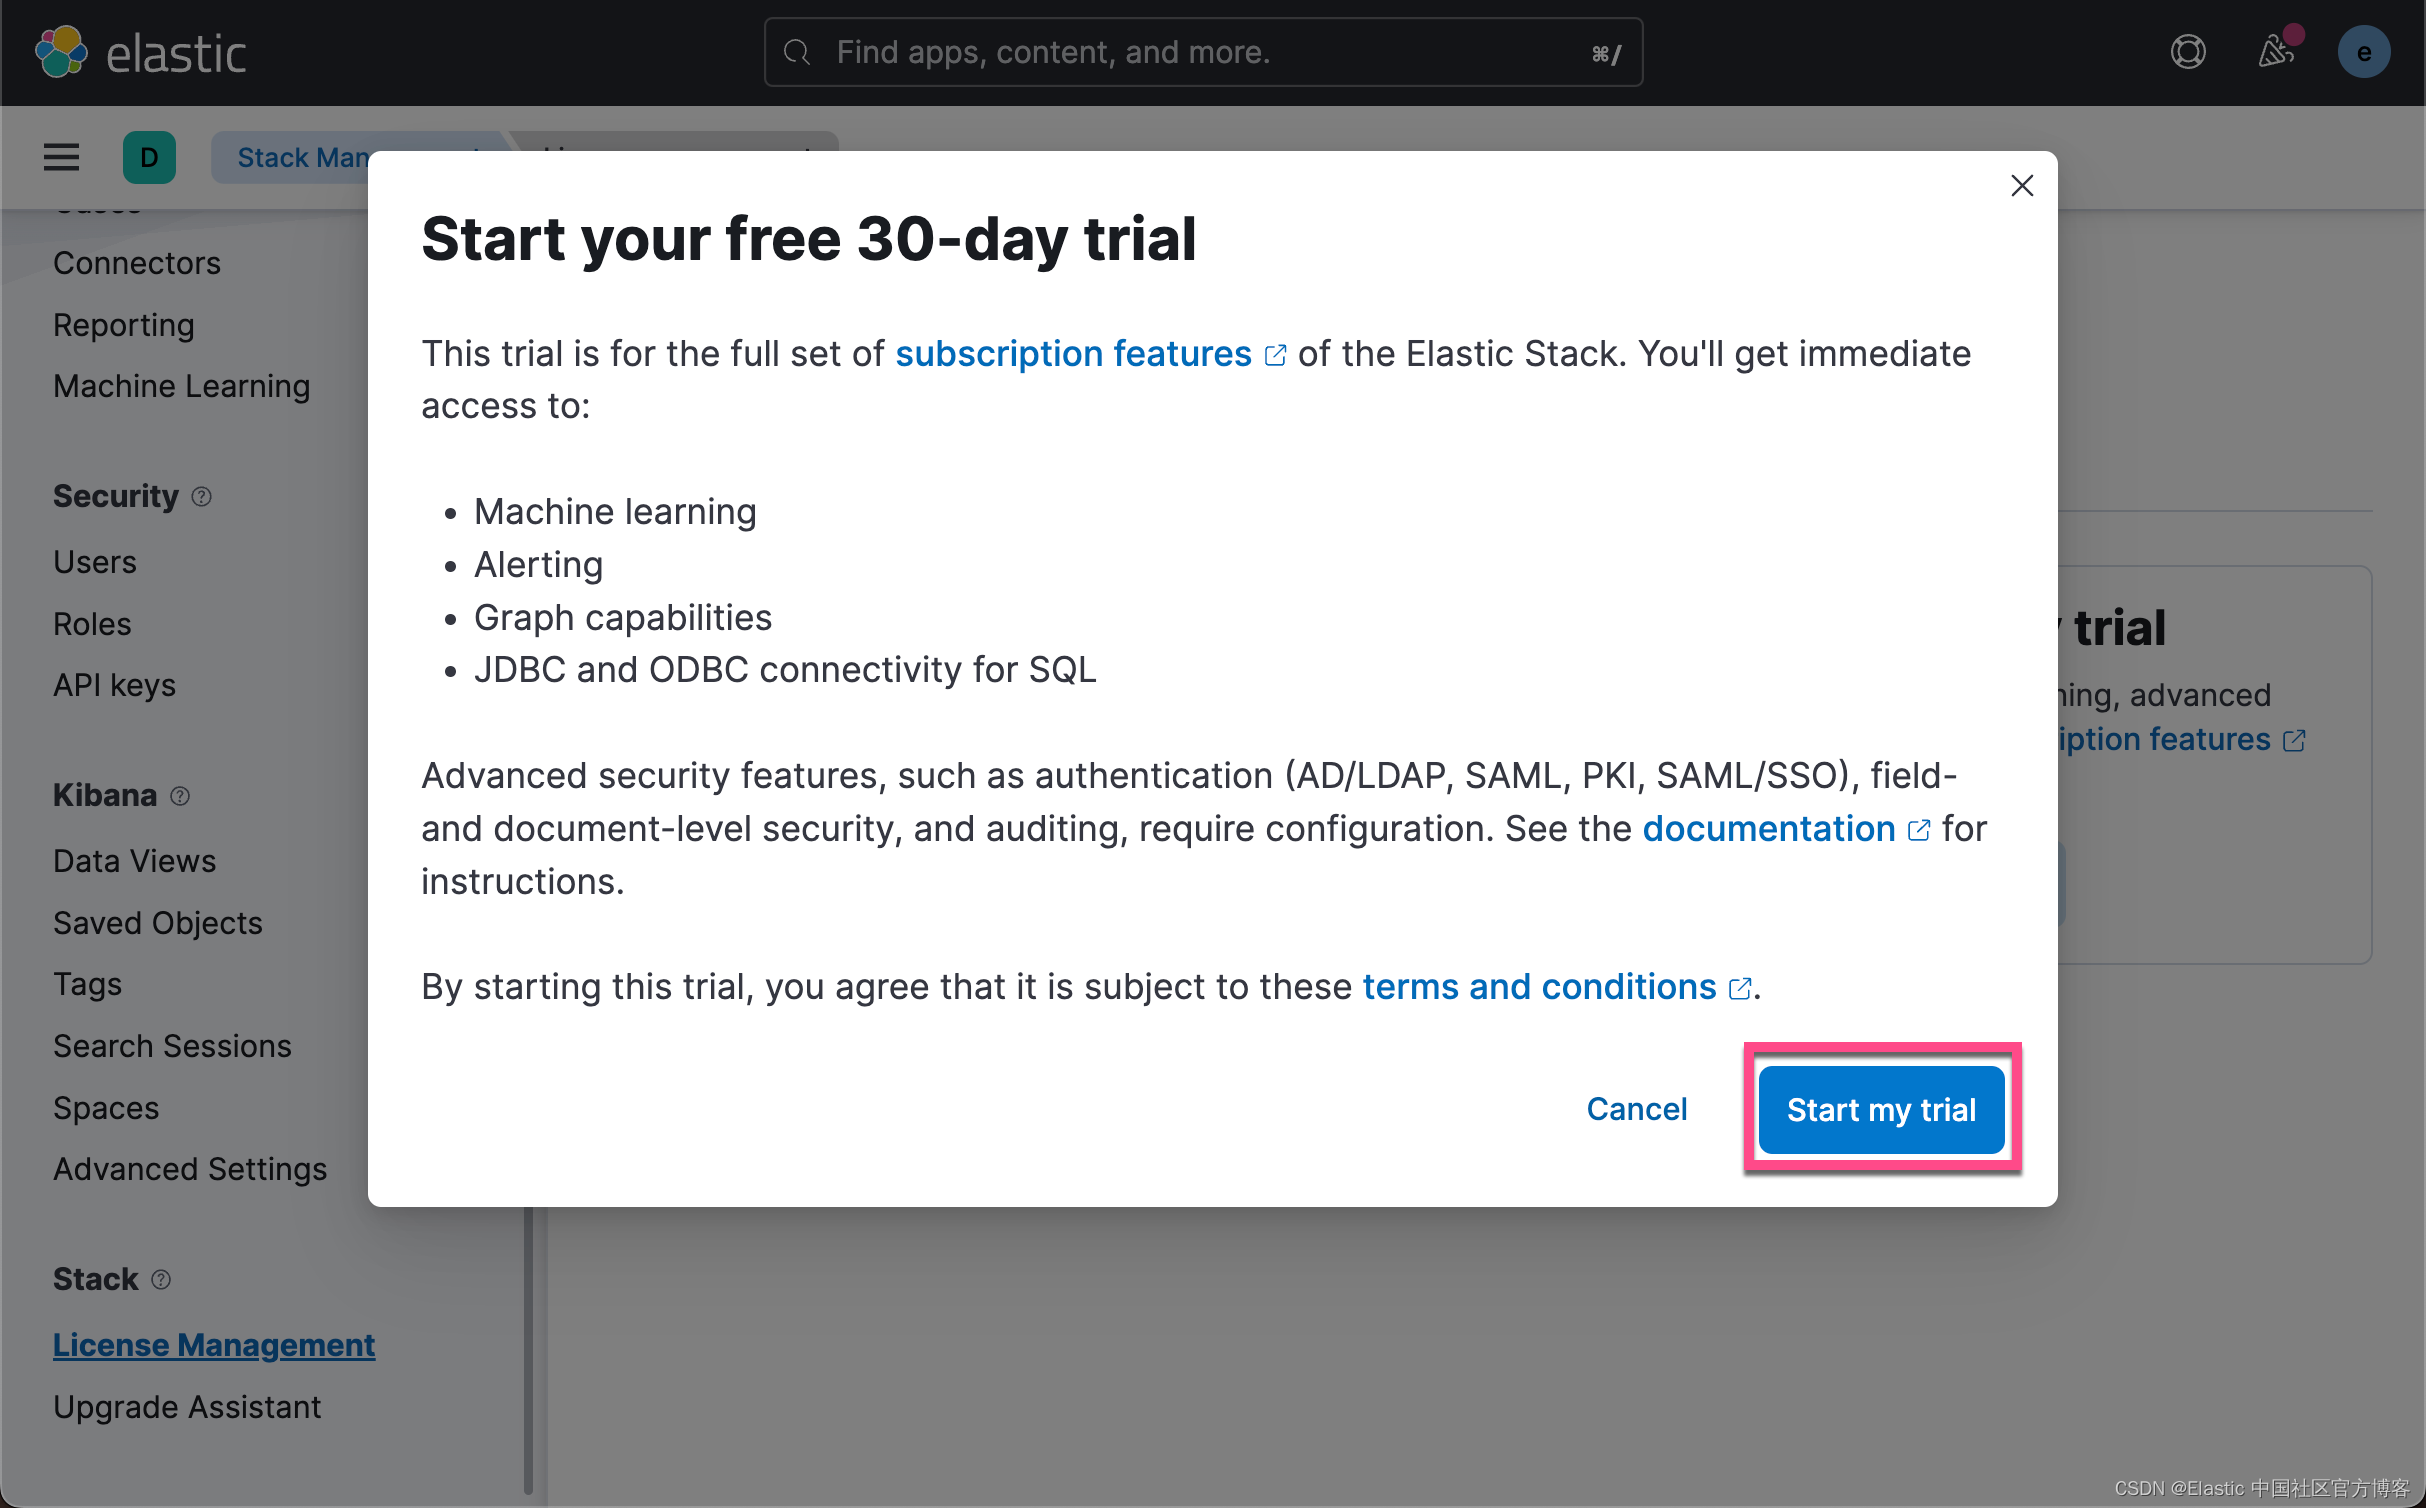
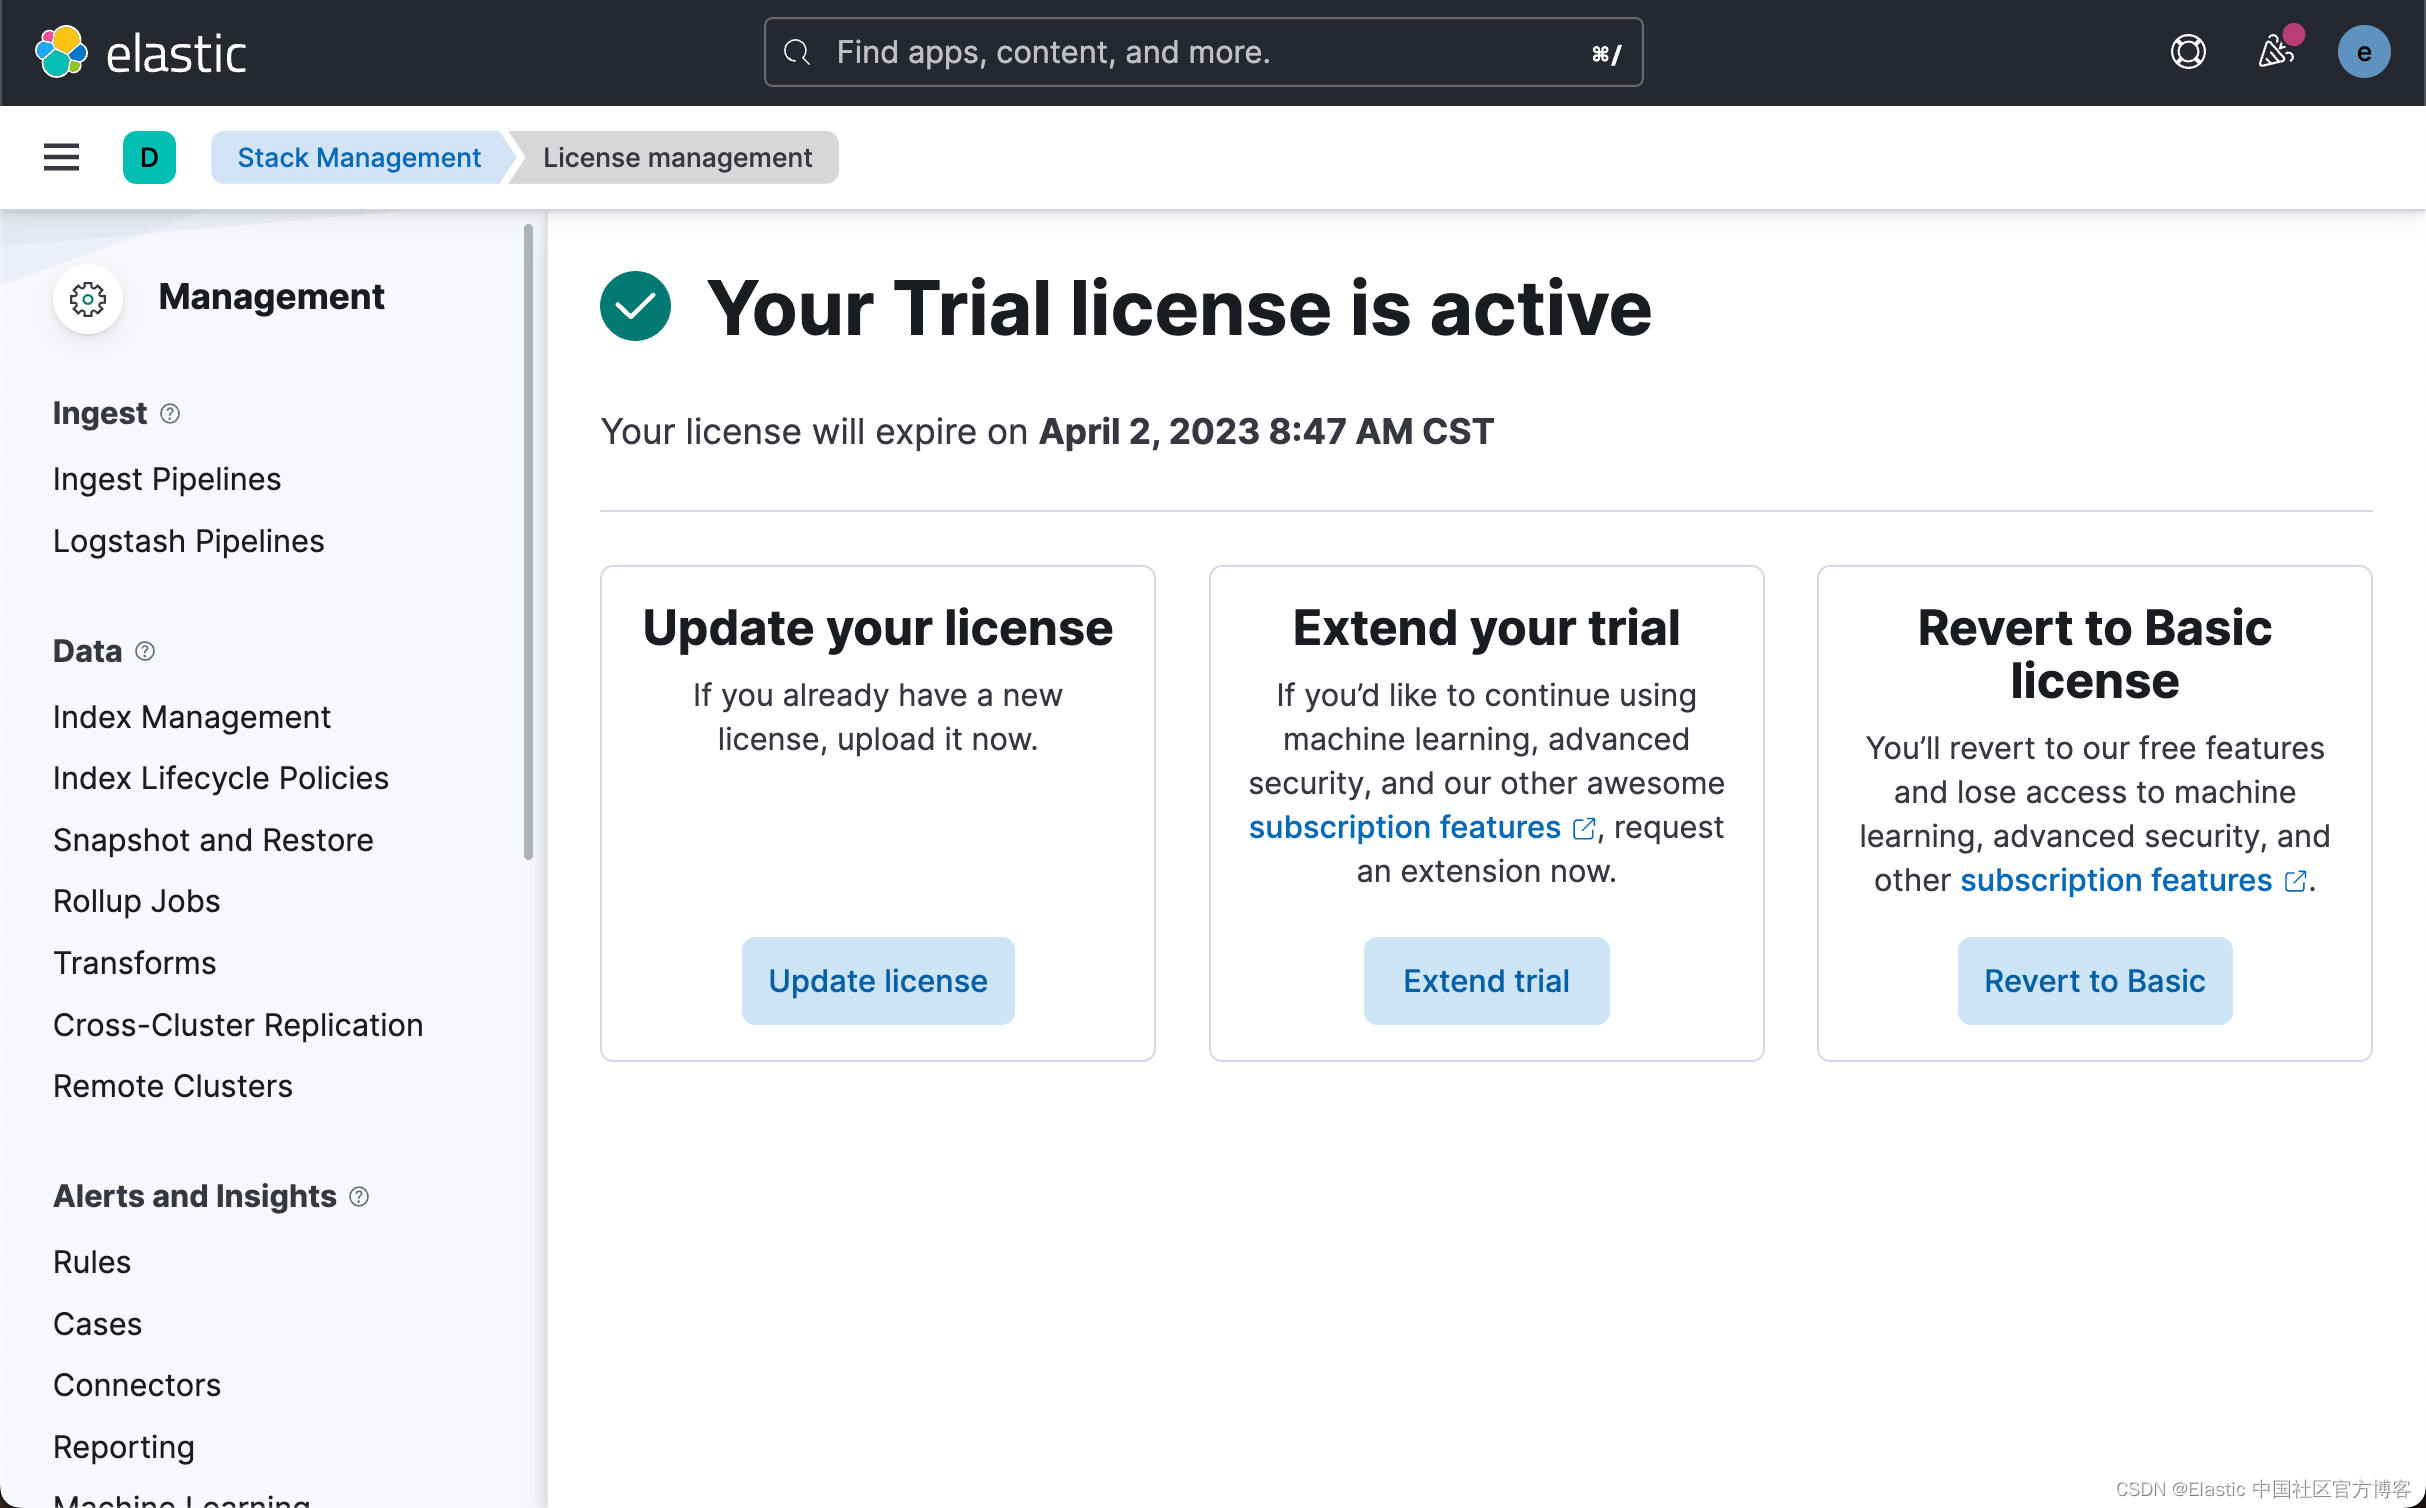
这样我们就成功地启动了白金版试用功能。
Elasticsearch 集群和嵌入模型
登录到你的帐户以启动 Elasticsearch 集群。 设置一个小型集群:
- 一个具有 2GB 内存的 HOT 节点
- 一个具有 4GB 内存的 ML(机器学习)节点(此节点的大小很重要,因为你将导入 Elasticsearch 的 NLP 模型会消耗约 1.5GB 的内存。)
部署准备就绪后,转到 Kibana 并检查机器学习节点的容量。 你将在视图中看到一个机器学习节点。 目前没有加载模型。
使用 Eland 库从 OpenAI 上传 CLIP 嵌入模型。 Eland 是一个 Python Elasticsearch 客户端,用于在 Elasticsearch 中探索和分析数据,能够处理文本和图像。 您将使用此模型从文本输入生成嵌入并查询匹配图像。 在 Eland 库的文档中找到更多详细信息。
对于下一步,你将需要 Elasticsearch 端点。 你可以从部署详细信息部分的 Elasticsearch 云控制台获取它。
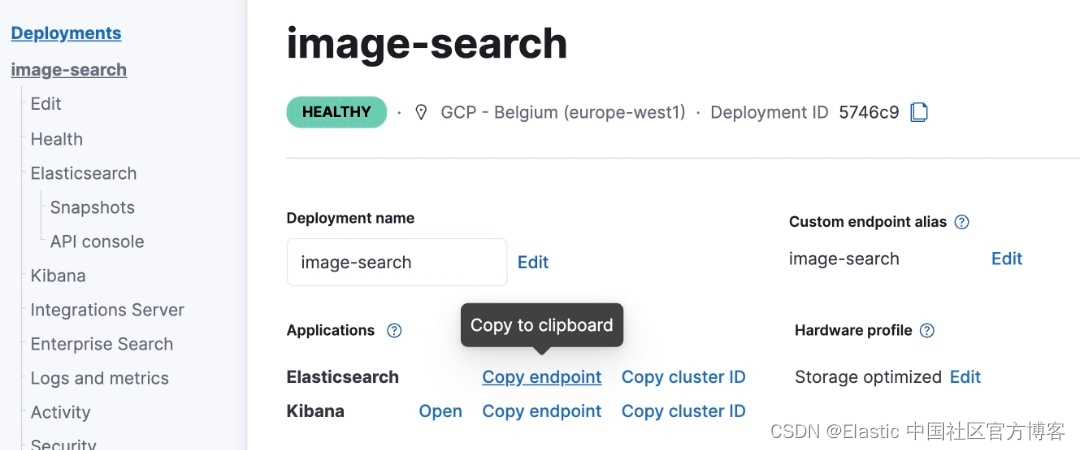
在本示例中,我们将使用本地部署来进行展示,所以,我们并不必要完成上面的步骤。
Eland
Eland 可以通过 pip 从 PyPI 安装。在安装之前,我们需要安装好自己的 Python。
1.  $ python --version
2.  Python 3.10.2
可以使用 Pip 从 PyPI 安装 Eland:
python -m pip install eland也可以使用 Conda 从 Conda Forge 安装 Eland:
conda install -c conda-forge eland希望在不安装 Eland 的情况下使用它的用户,为了只运行可用的脚本,可以构建 Docker 容器:
1.  git clone https://github.com/elastic/eland
2.  cd eland
3.  docker build -t elastic/eland .
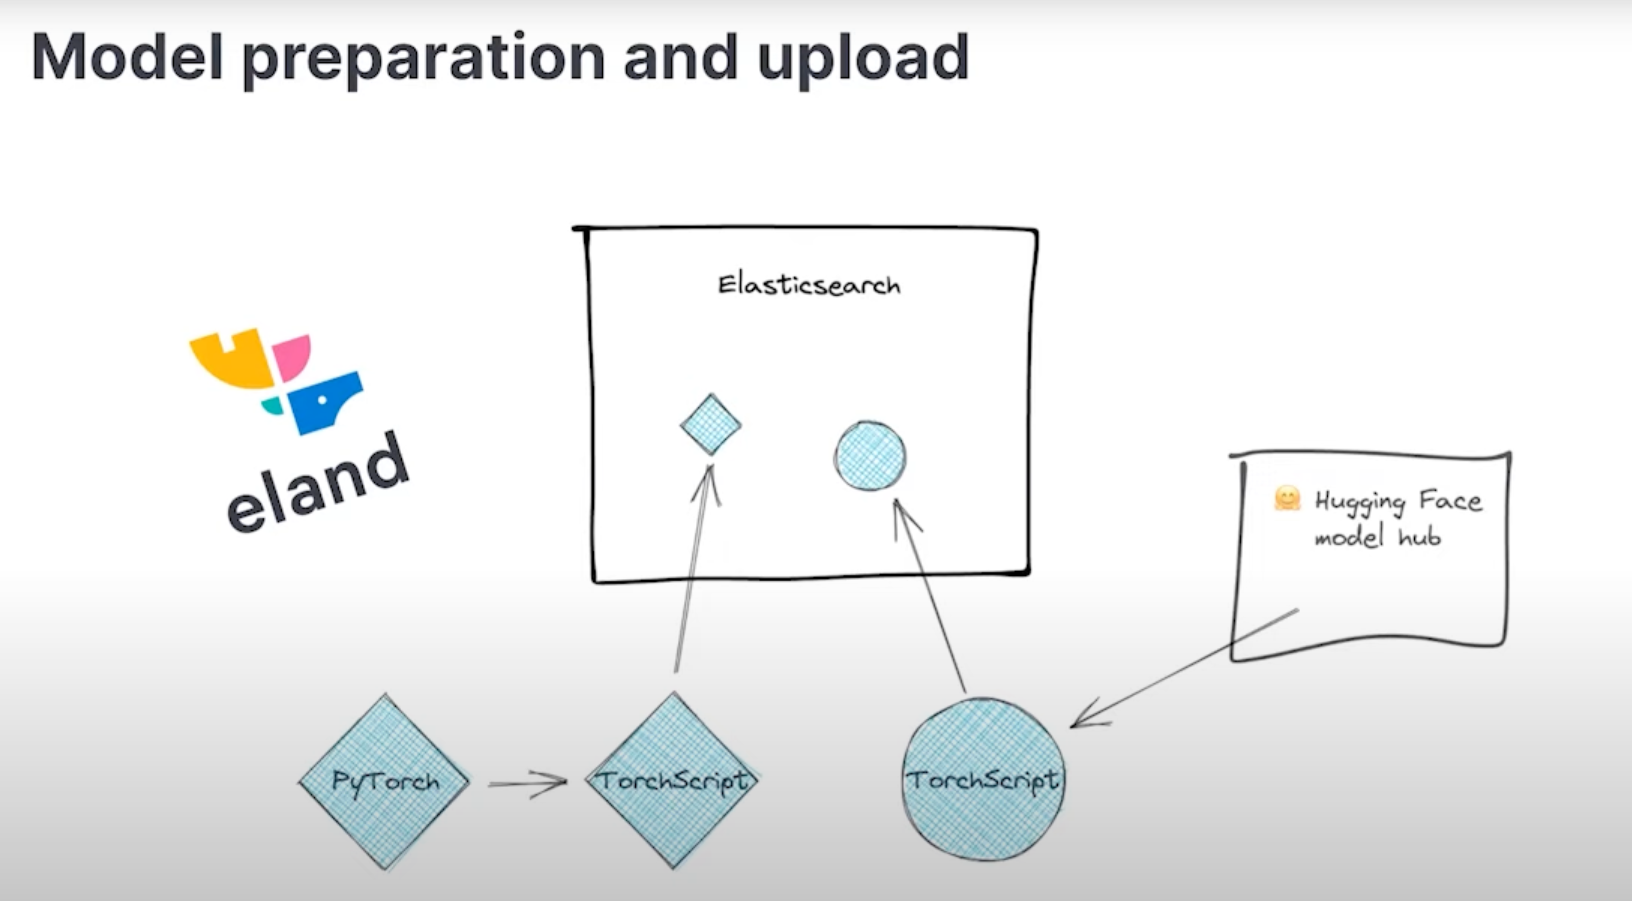
Eland 将 Hugging Face 转换器模型到其 TorchScript 表示的转换和分块过程封装在一个 Python 方法中; 因此,这是推荐的导入方法。
- 安装 Eland Python 客户端。
- 运行 eland_import_hub_model 脚本。 例如:
1.  eland_import_hub_model --url <clusterUrl> \
2.  --hub-model-id elastic/distilbert-base-cased-finetuned-conll03-english \
3. --task-type ner - 指定 URL 以访问你的集群。 例如,https://user>:
@ 。 - 在 Hugging Face 模型中心中指定模型的标识符。
- 指定 NLP 任务的类型。 支持的值为 fill_mask、ner、text_classification、text_embedding, question_answering 和 zero_shot_classification。
上传模型
我们使用如下的命令来进行上传模型:
1.  eland_import_hub_model --url https://<user>:<password>@<hostname>:<port> \
2.    --hub-model-id sentence-transformers/clip-ViT-B-32-multilingual-v1 \
3.    --task-type text_embedding \
4.    --ca-certs <your certificate> \
5.    --start
针对我的情况:
1.  eland_import_hub_model --url https://elastic:ZgzSt2vHNwA6yPn-fllr@localhost:9200 \
2.    --hub-model-id sentence-transformers/clip-ViT-B-32-multilingual-v1 \
3.    --task-type text_embedding \
4.    --ca-certs /Users/liuxg/elastic/elasticsearch-8.6.1/config/certs/http_ca.crt \
5.    --start
请注意: 你需要根据自己的 Elasticsearch 访问端点,用户名及密码来修改上面的设置,同时你需要根据自己的配置修改上面的证书路径。
运行上面的命令:
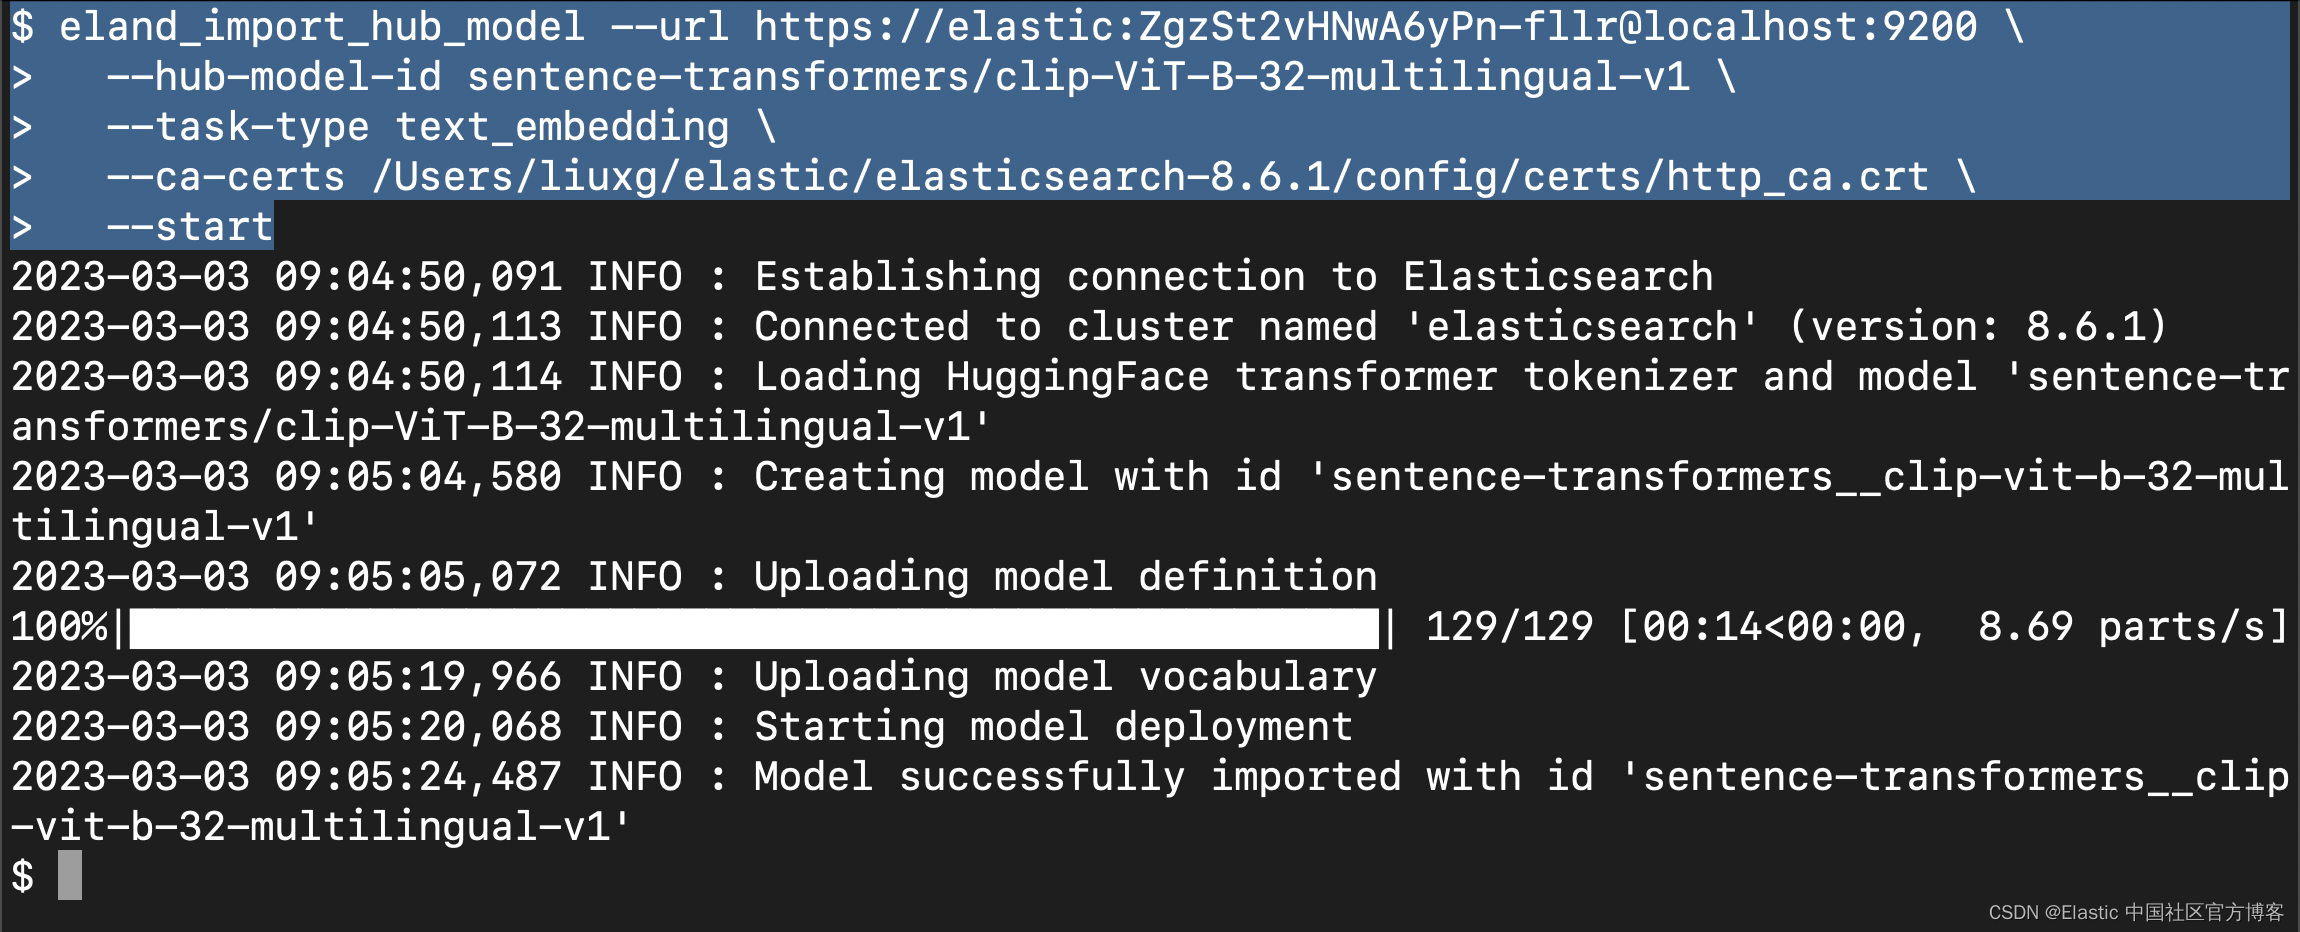
上面显示,我们已经成功地上传了模型。我们可以到 Kibana 中进行查看:
上面显示我们已经上传了所需要的 CLIP 模型,并且它的状态是 started。
如何创建图像嵌入
在设置 Elasticsearch 集群并导入嵌入模型后,你需要矢量化图像数据并为数据集中的每个图像创建图像嵌入。
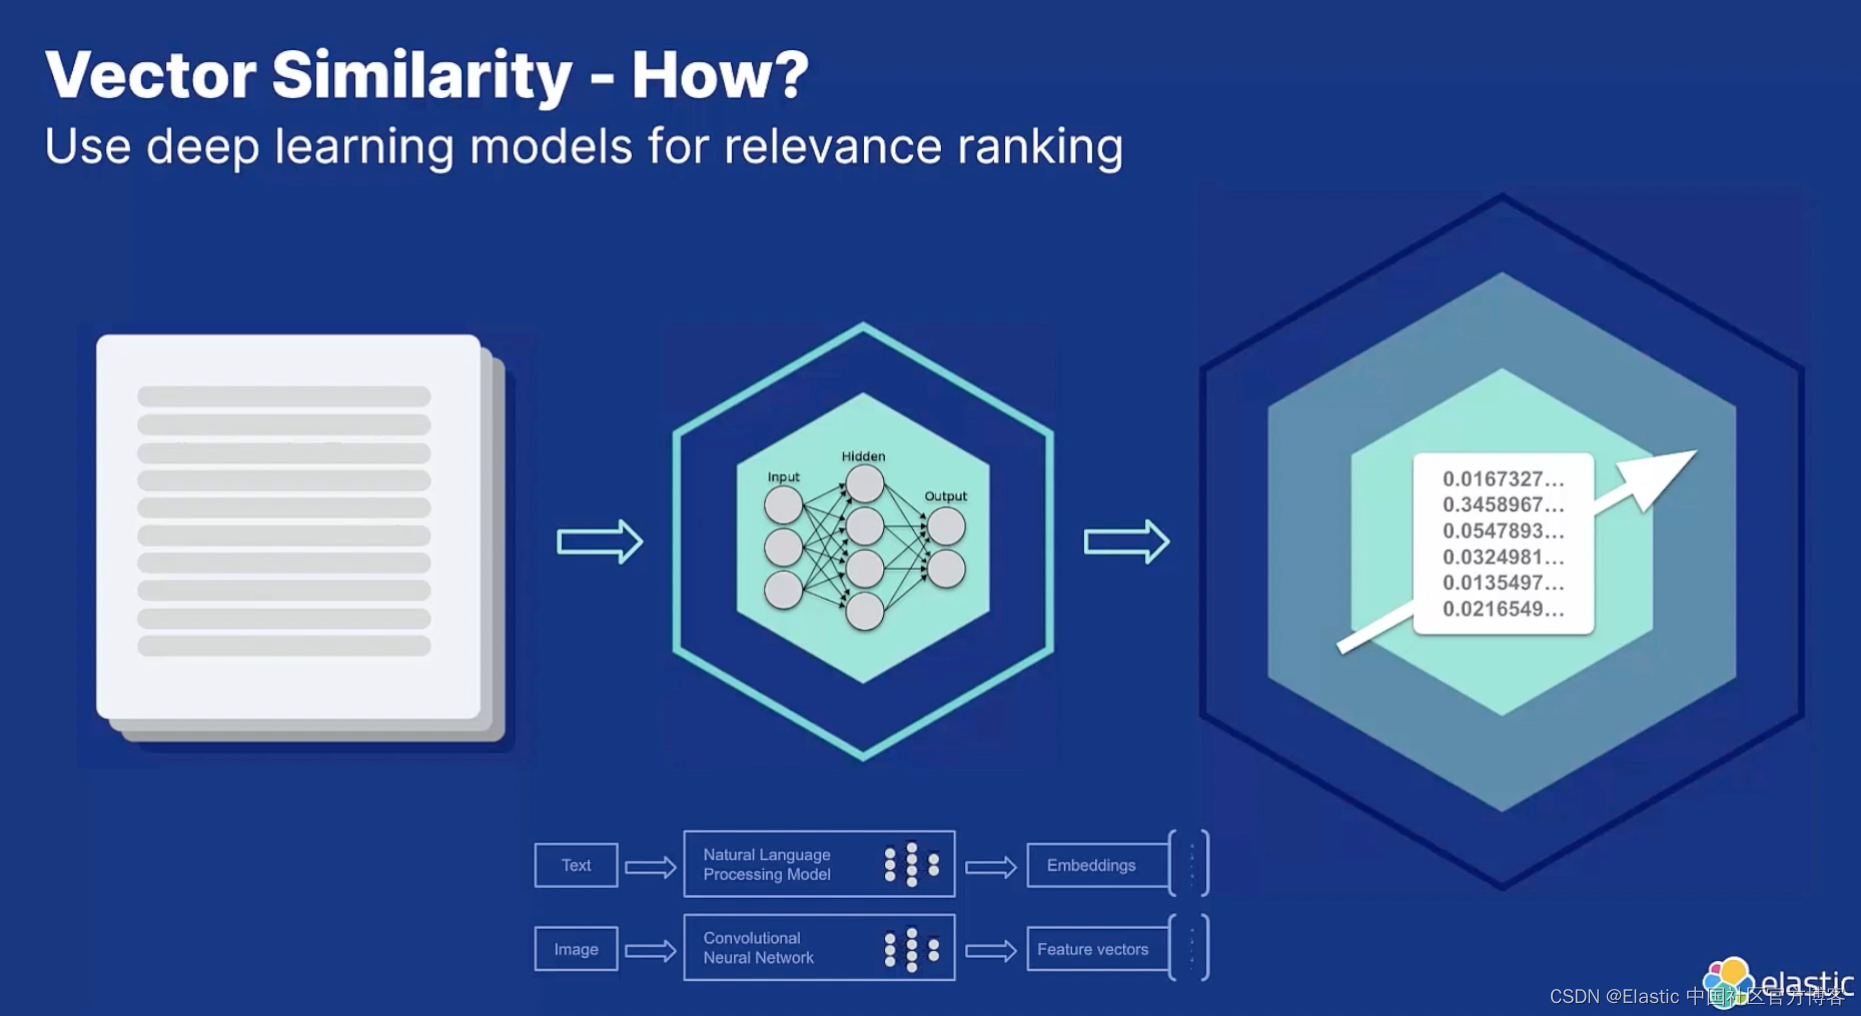
要创建图像嵌入,请使用简单的 Python 脚本。 你可以在此处找到该脚本:create-image-embeddings.py。 该脚本将遍历你的图像目录并生成单独的图像嵌入。 它将使用名称和相对路径创建文档,并使用提供的映射将其保存到 Elasticsearch 索引 my-image-embeddings 中。
将所有图像(照片)放入文件夹 app/static/images。 使用带有子文件夹的目录结构来组织图像。 所有图像准备就绪后,使用几个参数执行脚本。
至少要有几百张图像才能获得合理的结果,这一点至关重要。 图像太少不会产生预期的结果,因为你要搜索的空间非常小,而且到搜索向量的距离也非常相似。我尝试在网上下载很多的照片,但是感觉一张一张地下载非常麻烦。你可以在谷歌浏览器中添加插件 Image downloader - Imageye。它可以方便地把很多照片一次下载下来。
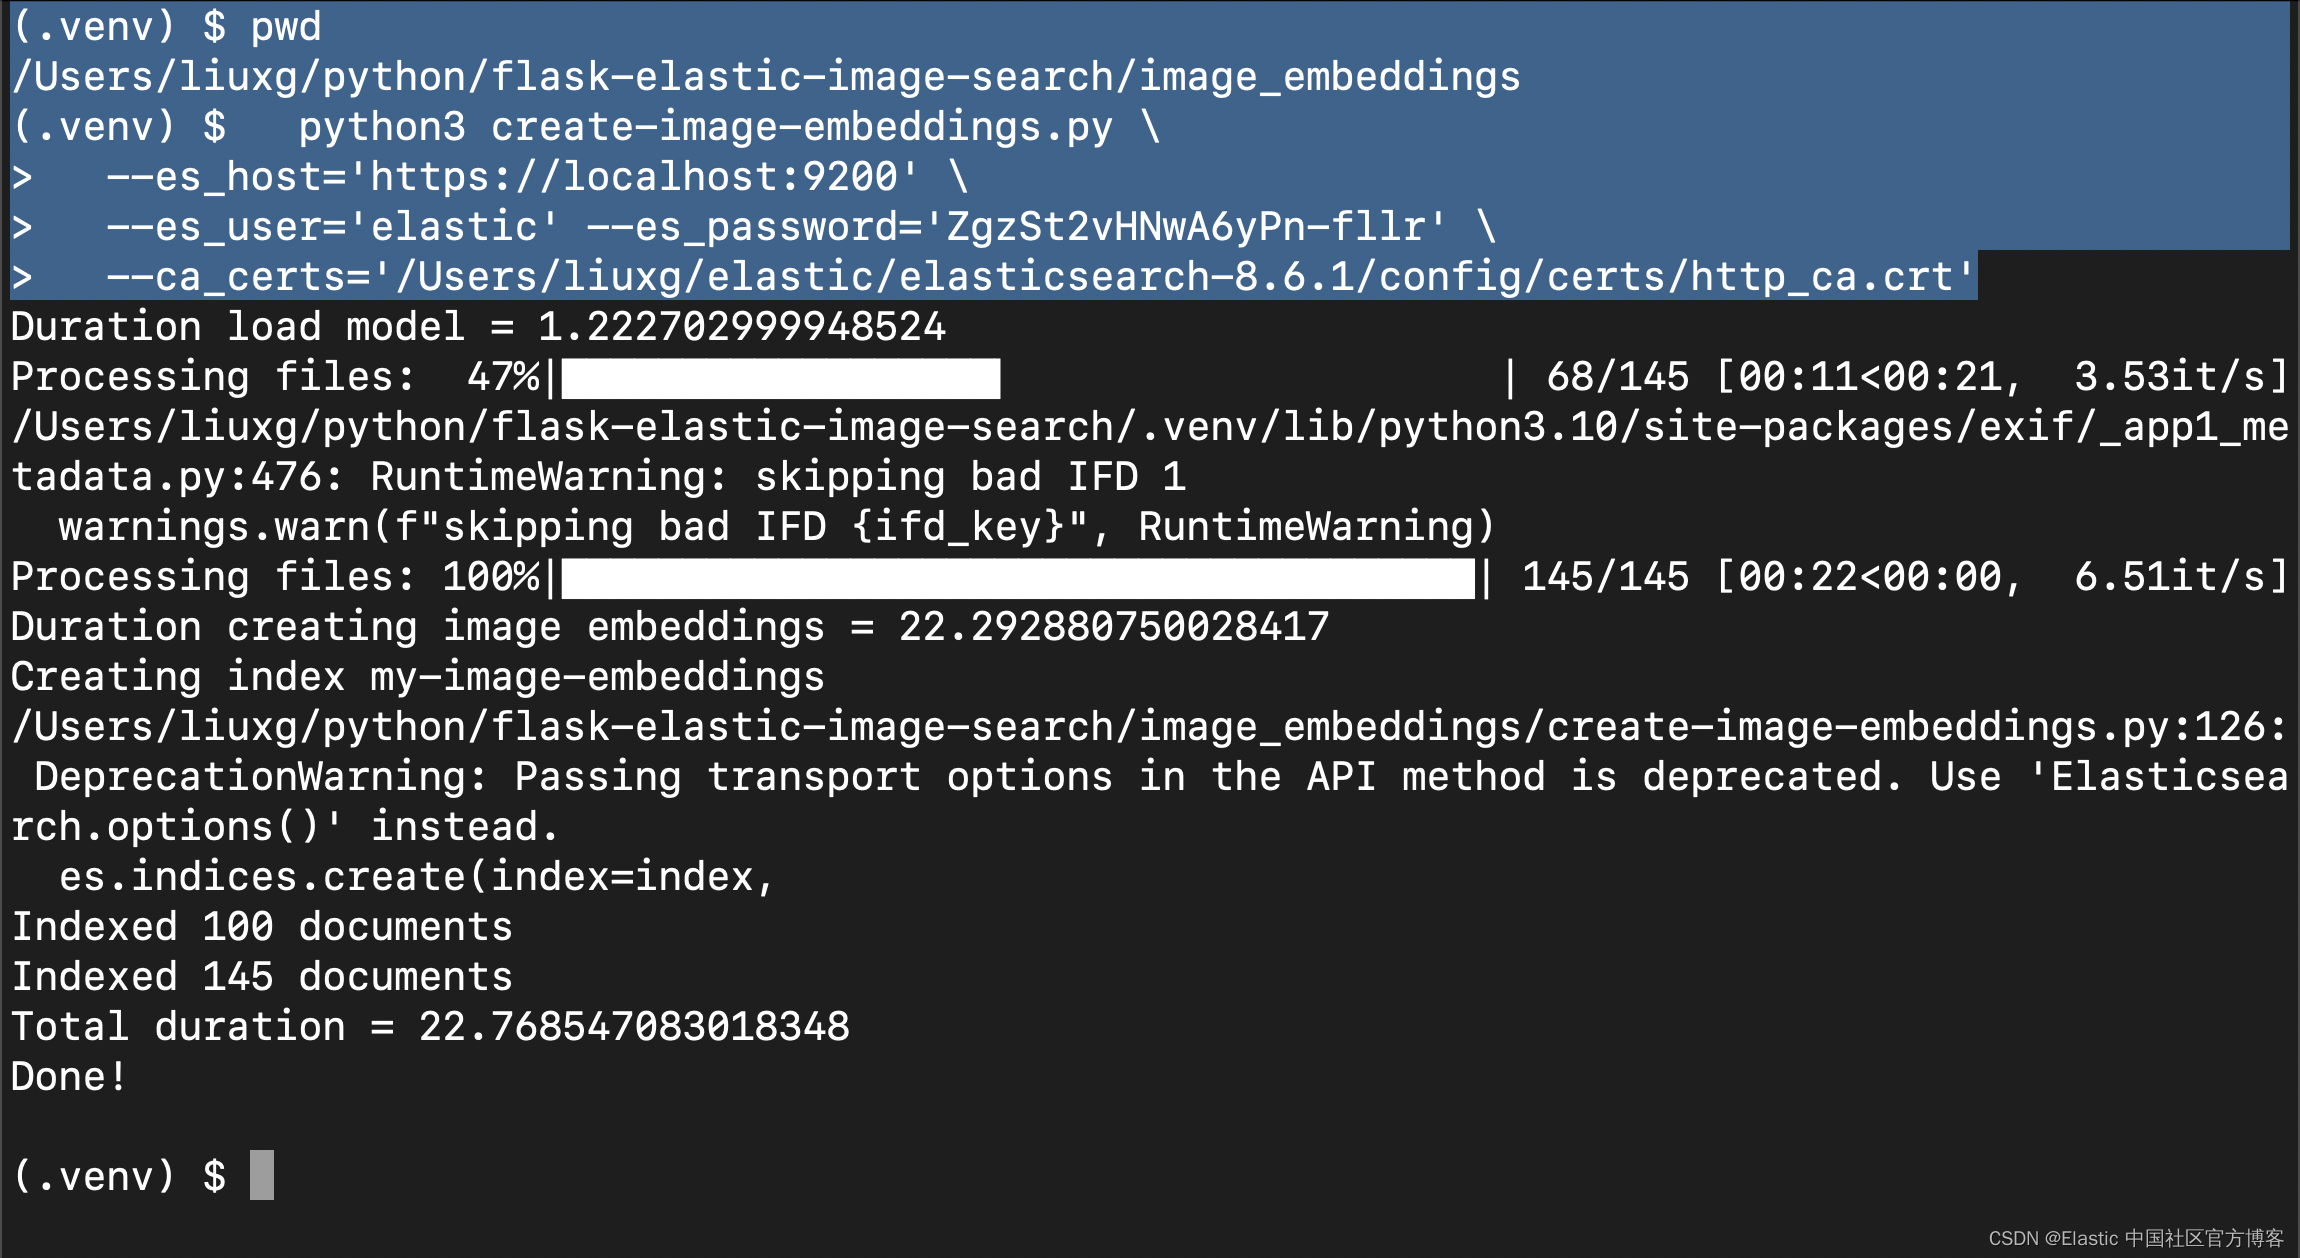
在 image_embeddings 文件夹中,运行脚本并为变量使用你的值。
1.  cd image_embeddings
2.  python3 create-image-embeddings.py \
3.    --es_host='https://localhost:9200' \
4.    --es_user='elastic' --es_password='ZgzSt2vHNwA6yPn-fllr' \
5.    --ca_certs='/Users/liuxg/elastic/elasticsearch-8.6.1/config/certs/http_ca.crt'
根据图像的数量、它们的大小、你的 CPU 和你的网络连接,此任务将需要一些时间。 在尝试处理完整数据集之前,先试验少量图像。脚本完成后,你可以使用 Kibana 开发工具验证索引 my-image-embeddings 是否存在并具有相应的文档。
我们在Kibana 中进行查看:
GET _cat/indices/my-image-embeddings?v上面命令的响应为:
1.  health status index               uuid                   pri rep docs.count docs.deleted store.size pri.store.size
2.  yellow open   my-image-embeddings h6oUBdHCScWmXOZaf57oWg   1   1        145            0      1.4mb          1.4mb
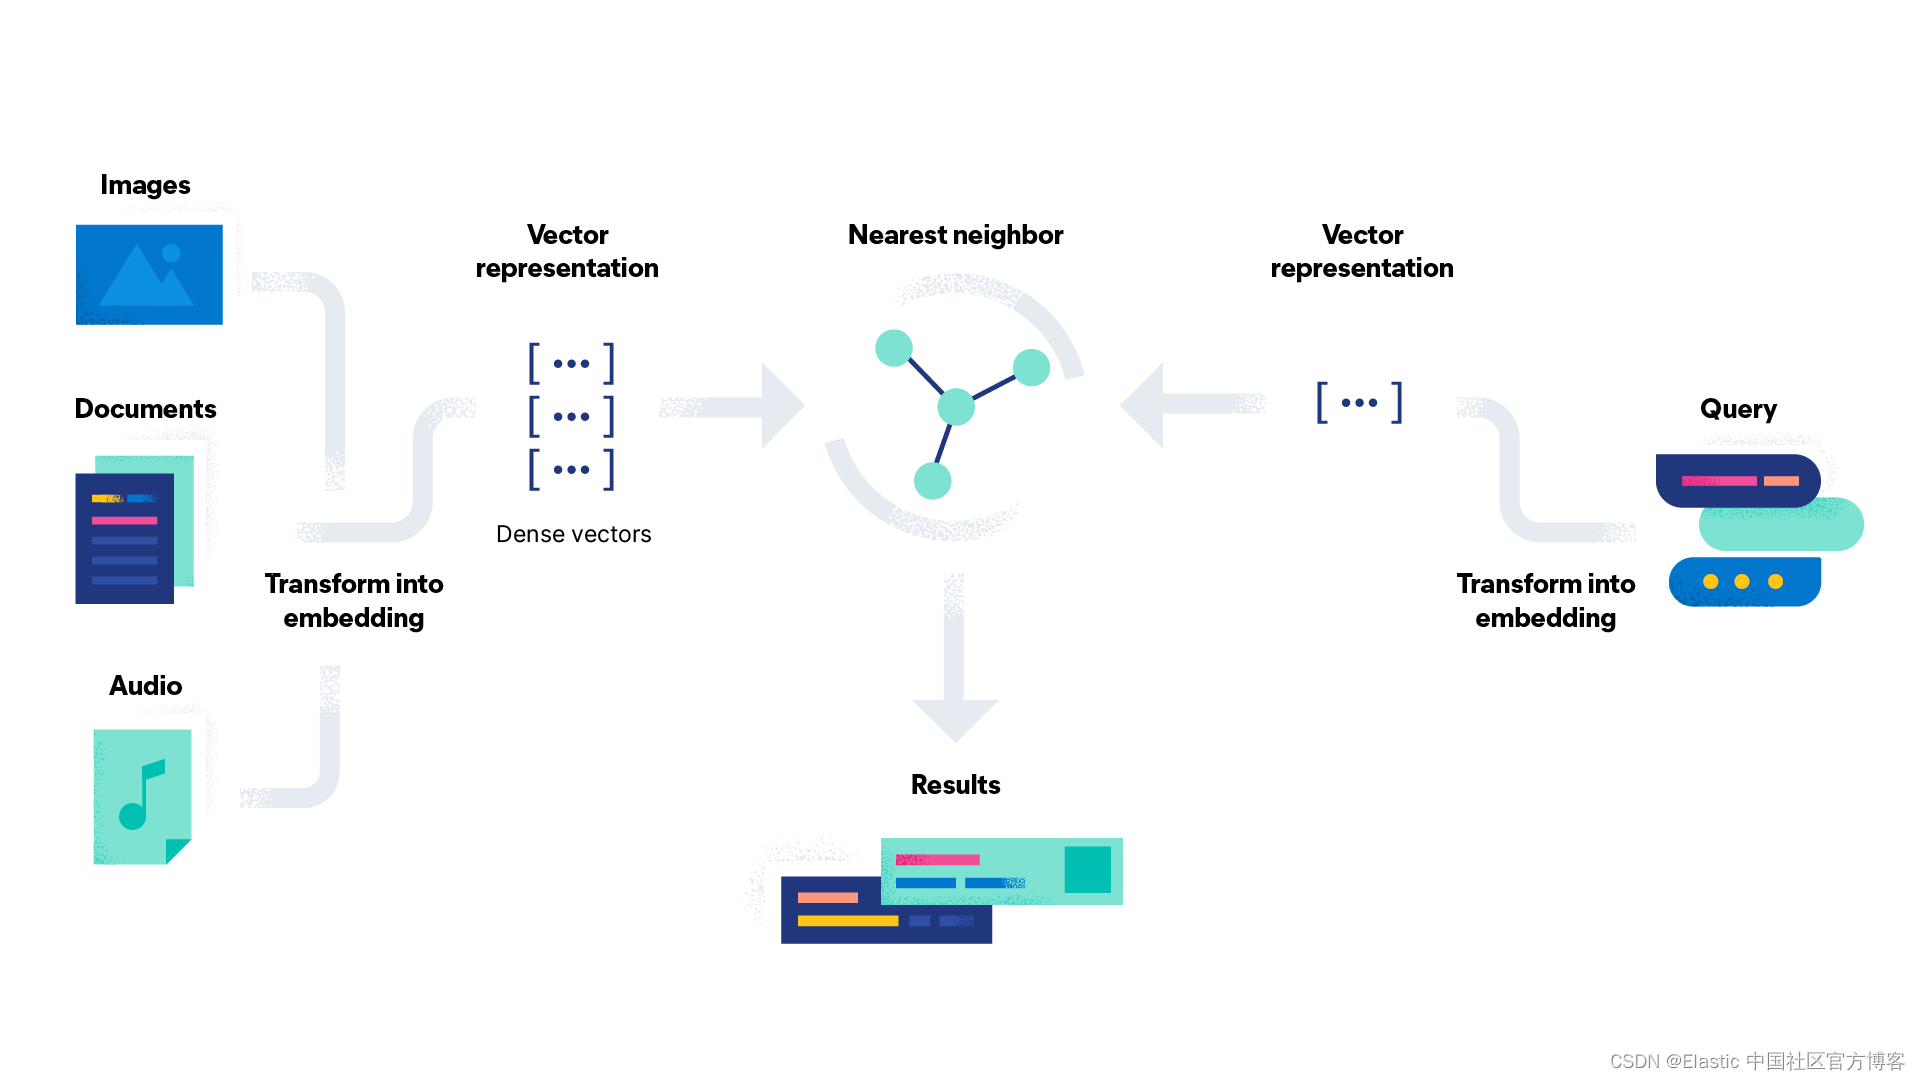
查看文档,你会看到非常相似的 JSON 对象(如示例)。 你将在图像文件夹中看到图像名称、图像 ID 和相对路径。 此路径用于前端应用程序以在搜索时正确显示图像。JSON 文档中最重要的部分是包含 CLIP 模型生成的密集矢量的 image_embedding。 当应用程序正在搜索图像或类似图像时使用此矢量。
GET my-image-embeddings/_search
1.  {
2.     "_index": "my-image-embeddings",
3.     "_id": "_g9ACIUBMEjlQge4tztV",
4.     "_score": 6.703597,
5.     "_source": {
6.       "image_id": "IMG_4032",
7.       "image_name": "IMG_4032.jpeg",
8.       "image_embedding": [
9.         -0.3415695130825043,
10.         0.1906963288784027,
11.         .....
12.         -0.10289803147315979,
13.         -0.15871885418891907
14.         ],
15.       "relative_path": "phone/IMG_4032.jpeg"
16.     }
17.  }
使用 Flask 应用程序搜索图像
现在你的环境已全部设置完毕,你可以进行下一步,使用我们作为概念证明提供的 Flask 应用程序,使用自然语言实际搜索图像并查找相似图像。 该 Web 应用程序具有简单的 UI,使图像搜索变得简单。 你可以在此 GitHub 存储库中访问原型 Flask 应用程序。
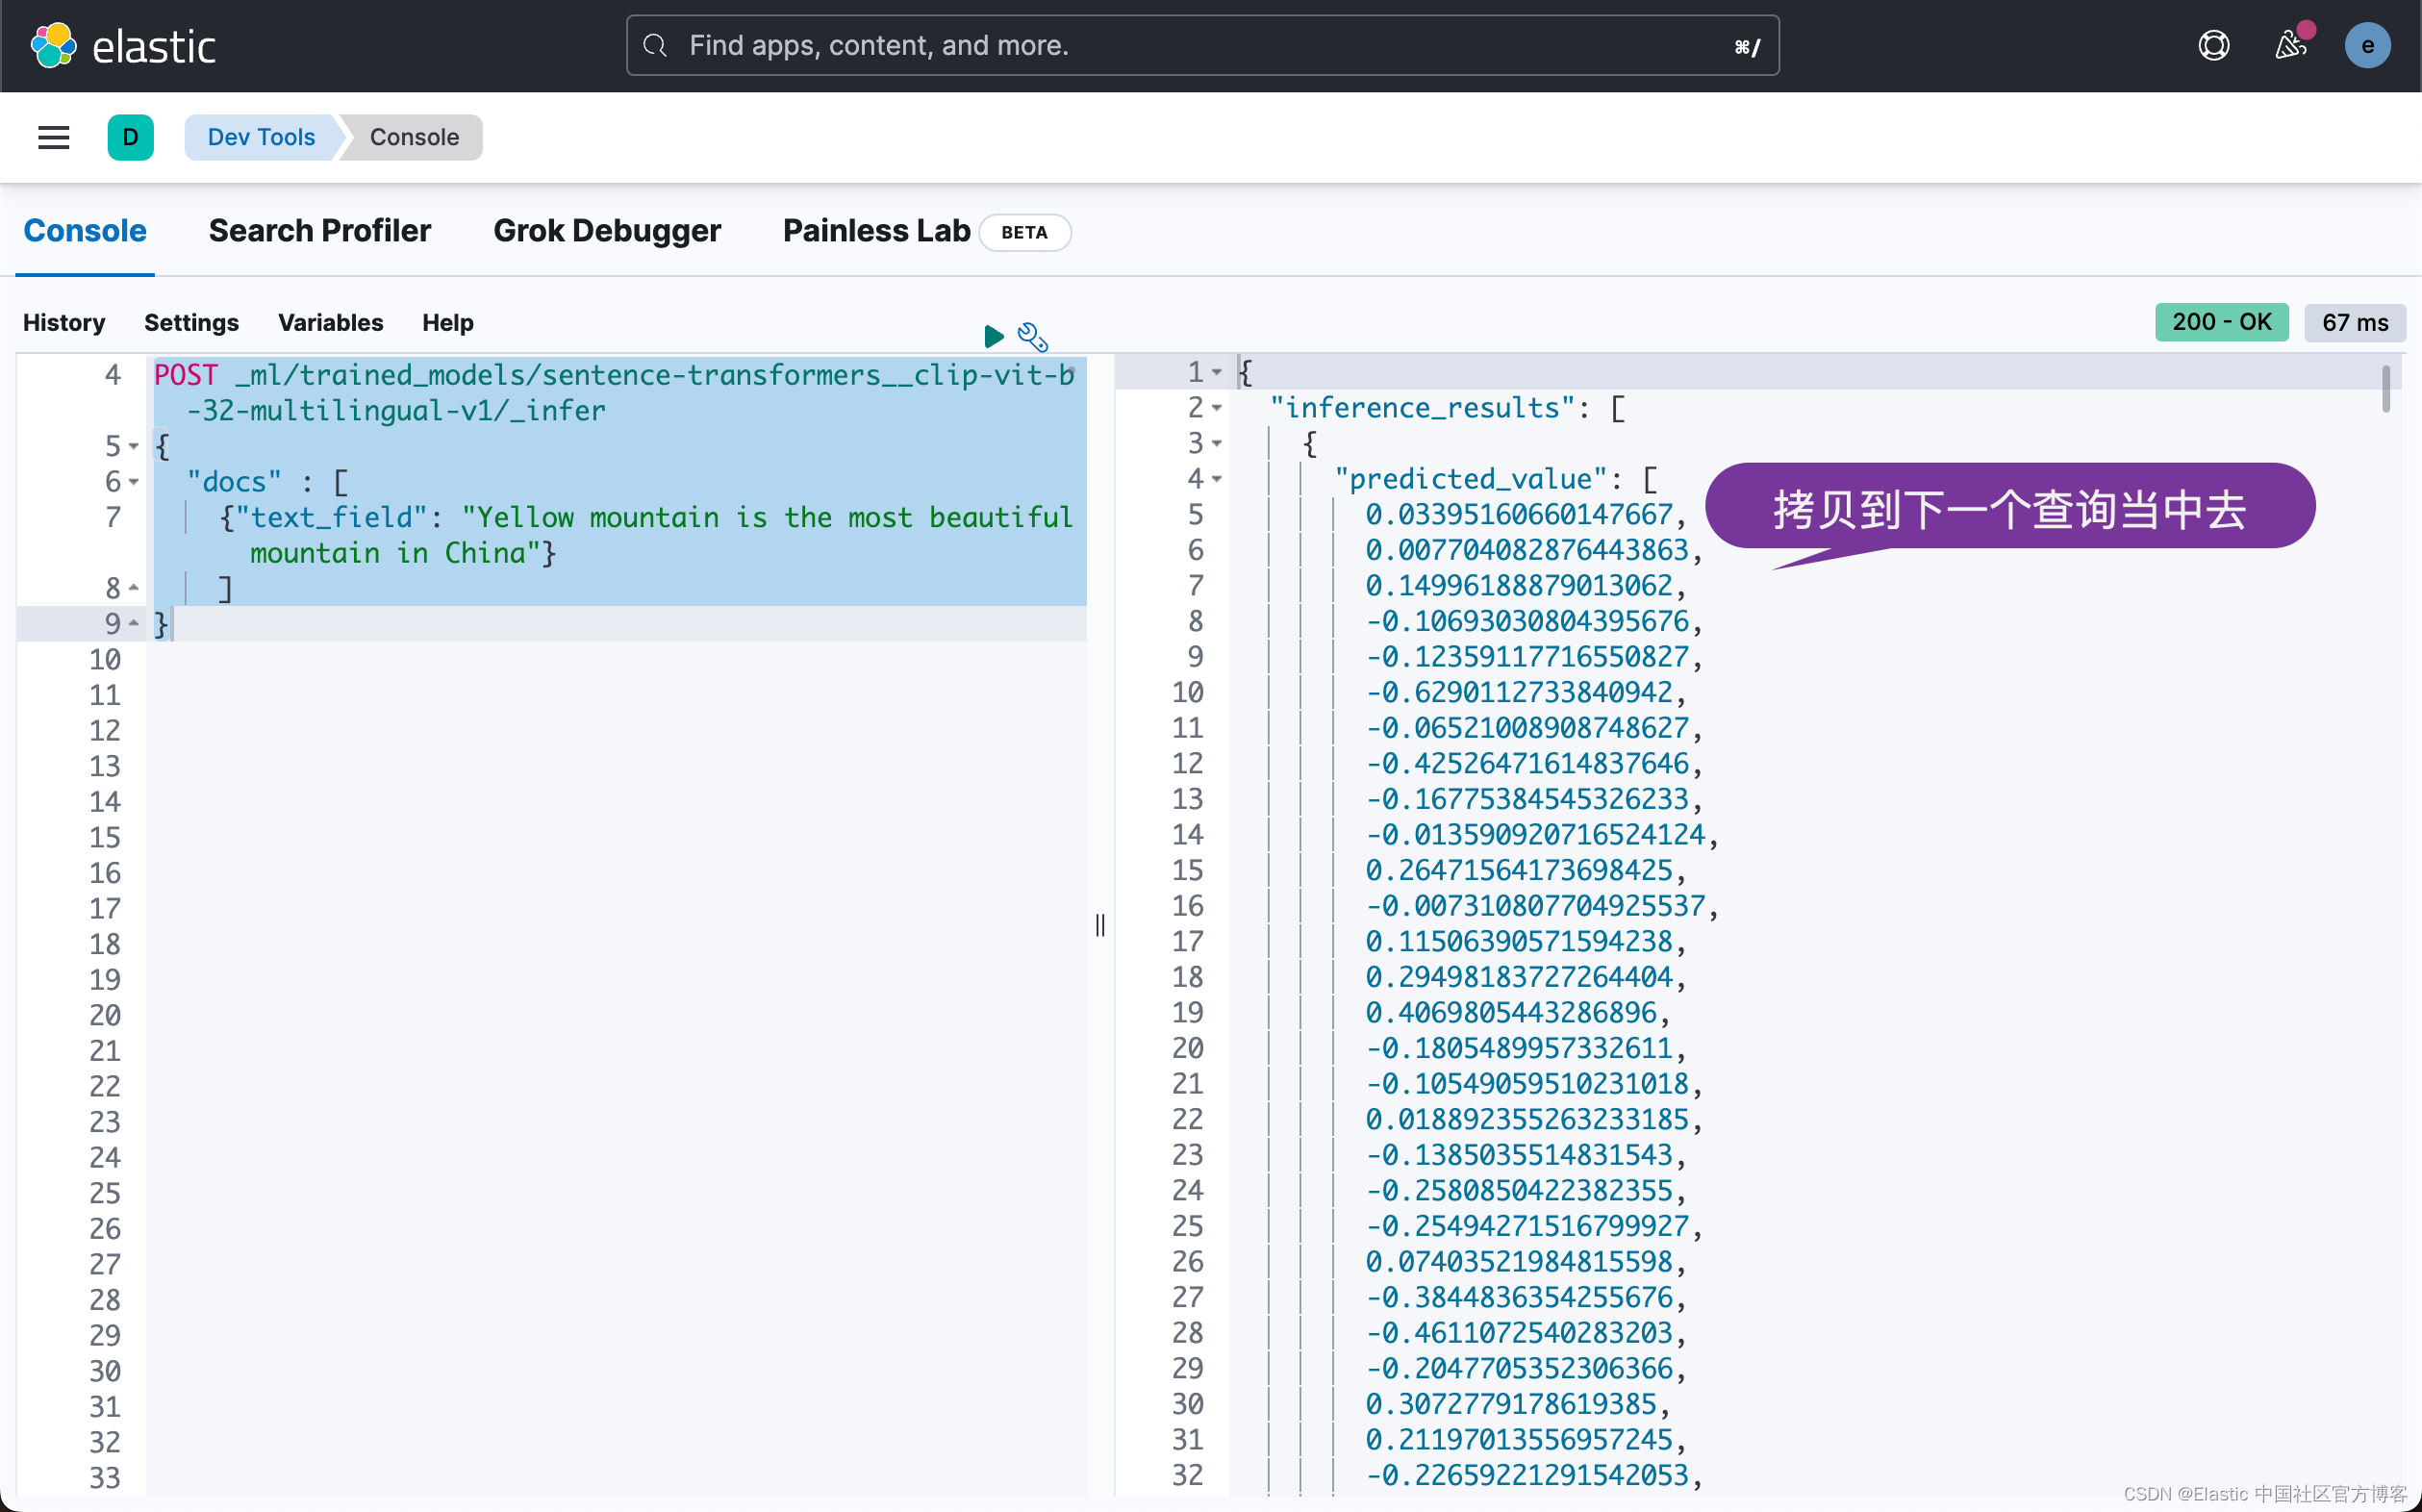
后台应用程序执行两个任务。 在搜索框中输入搜索字符串后,文本将使用机器学习 _infer 端点进行矢量化。 然后,针对带有向量的索引 my-image-embeddings 执行带有密集向量的查询。
你可以在示例中看到这两个查询。 第一个 API 调用使用 _infer 端点,结果是一个密集矢量。
1.  POST _ml/trained_models/sentence-transformers__clip-vit-b-32-multilingual-v1/_infer
2.  {
3.    "docs" : [
4.      {"text_field": "Yellow mountain is the most beautiful mountain in China"}
5.      ]
6.  }
上面的响应如下:
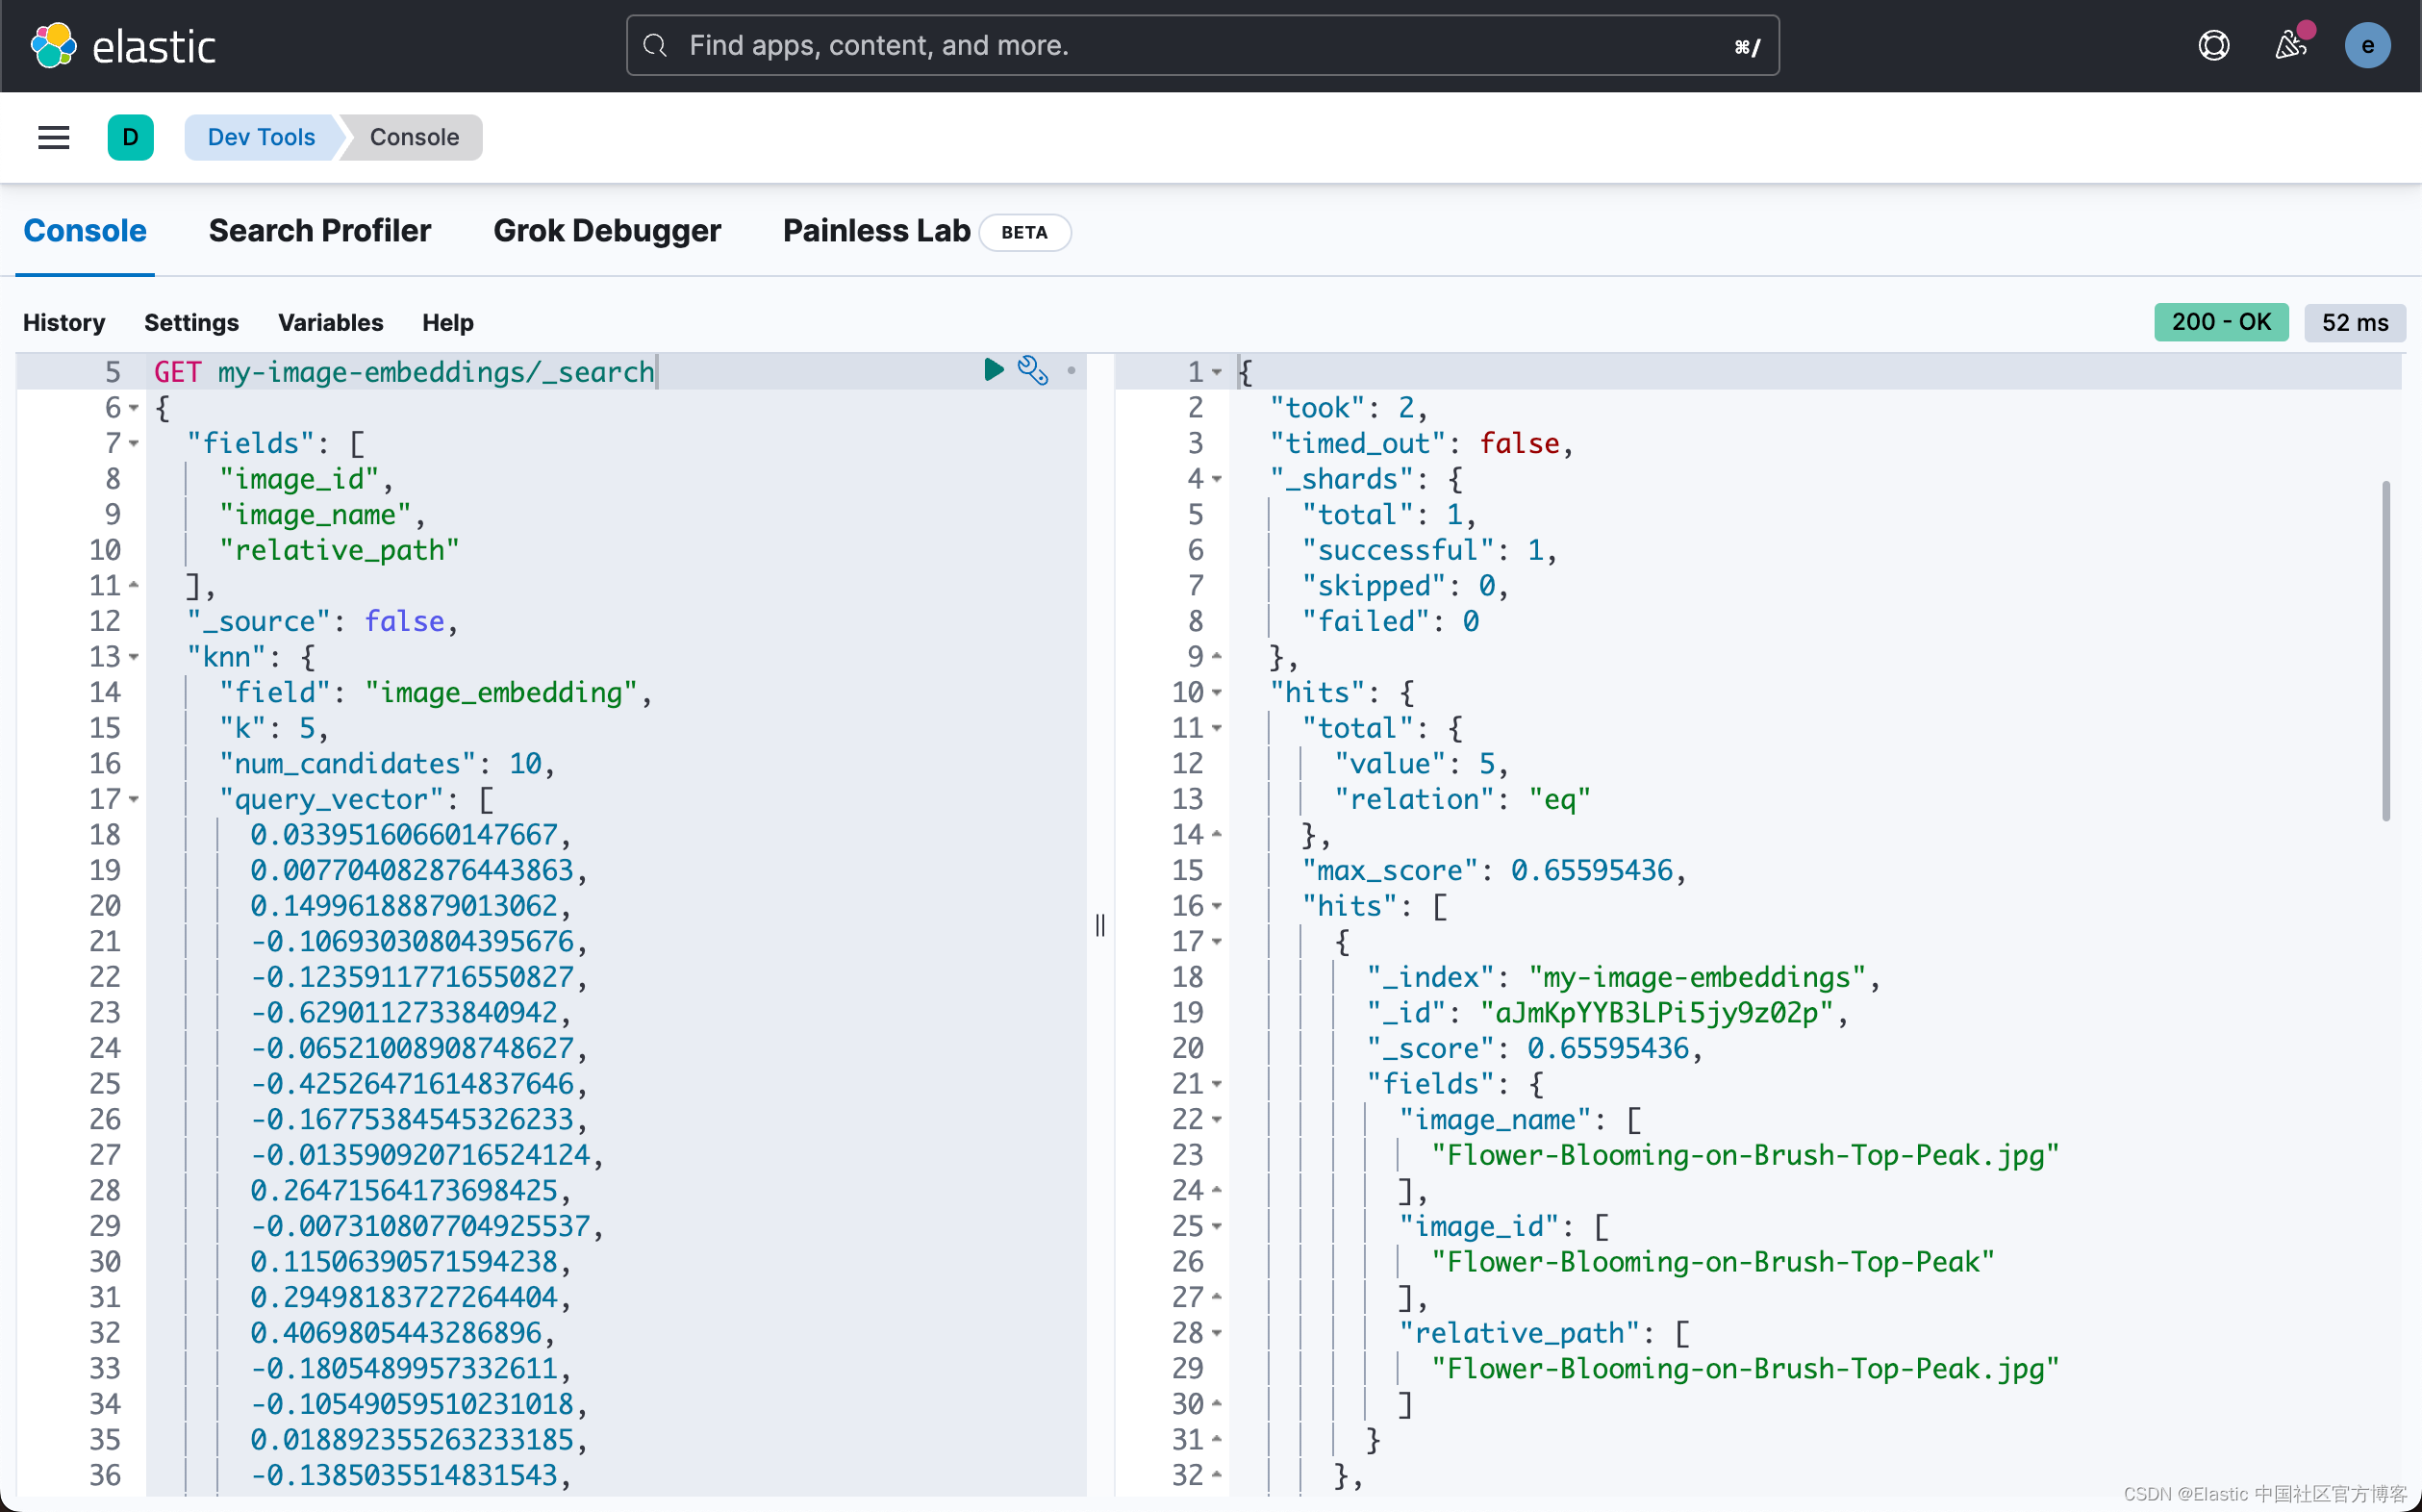
在第二个任务中,搜索查询,我们将使用密集矢量并获得按分数排序的图像。
`
1. GET my-image-embeddings/_search
2. {
3. "fields": [
4. "image_id",
5. "image_name",
6. "relative_path"
7. ],
8. "_source": false,
9. "knn": {
10. "field": "image_embedding",
11. "k": 5,
12. "num_candidates": 10,
13. "query_vector": [
14. 0.03395160660147667,
15. 0.007704082876443863,
16. 0.14996188879013062,
17. -0.10693030804395676,
18. ...
19. 0.05140634626150131,
20. 0.07114913314580917
21. ]
22. }
23. }
`
要启动并运行 Flask 应用程序,请导航到存储库的根文件夹并配置 .env 文件。 配置文件中的值用于连接到 Elasticsearch 集群。 你需要为以下变量插入值。 这些与图像嵌入生成中使用的值相同。
.env
1.  ES_HOST='URL:PORT'
2.  ES_USER='elastic'
3.  ES_PWD='password'
为了能够使得我们自构建的 Elasticsearch 集群能够被正确地访问,我们必须把 Elasticsearch 的根证书拷贝到 Flask 应用的相应目录中:
flask-elastic-image-search/app/conf/ca.crt
1.  (.venv) $ pwd
2.  /Users/liuxg/python/flask-elastic-image-search/app/conf
3.  (.venv) $ cp ~/elastic/elasticsearch-8.6.1/config/certs/http_ca.crt ca.crt
4.  overwrite ca.crt? (y/n [n]) y
在上面,我们替换了仓库中原有的证书文件 ca.crt。
准备就绪后,运行主文件夹中的 flask 应用程序并等待它启动。
1.  # In the main directory
2.  $ flask run --port=5001
如果应用程序启动,你将看到类似于下面的输出,它在末尾指示你需要访问哪个 URL 才能访问该应用程序。
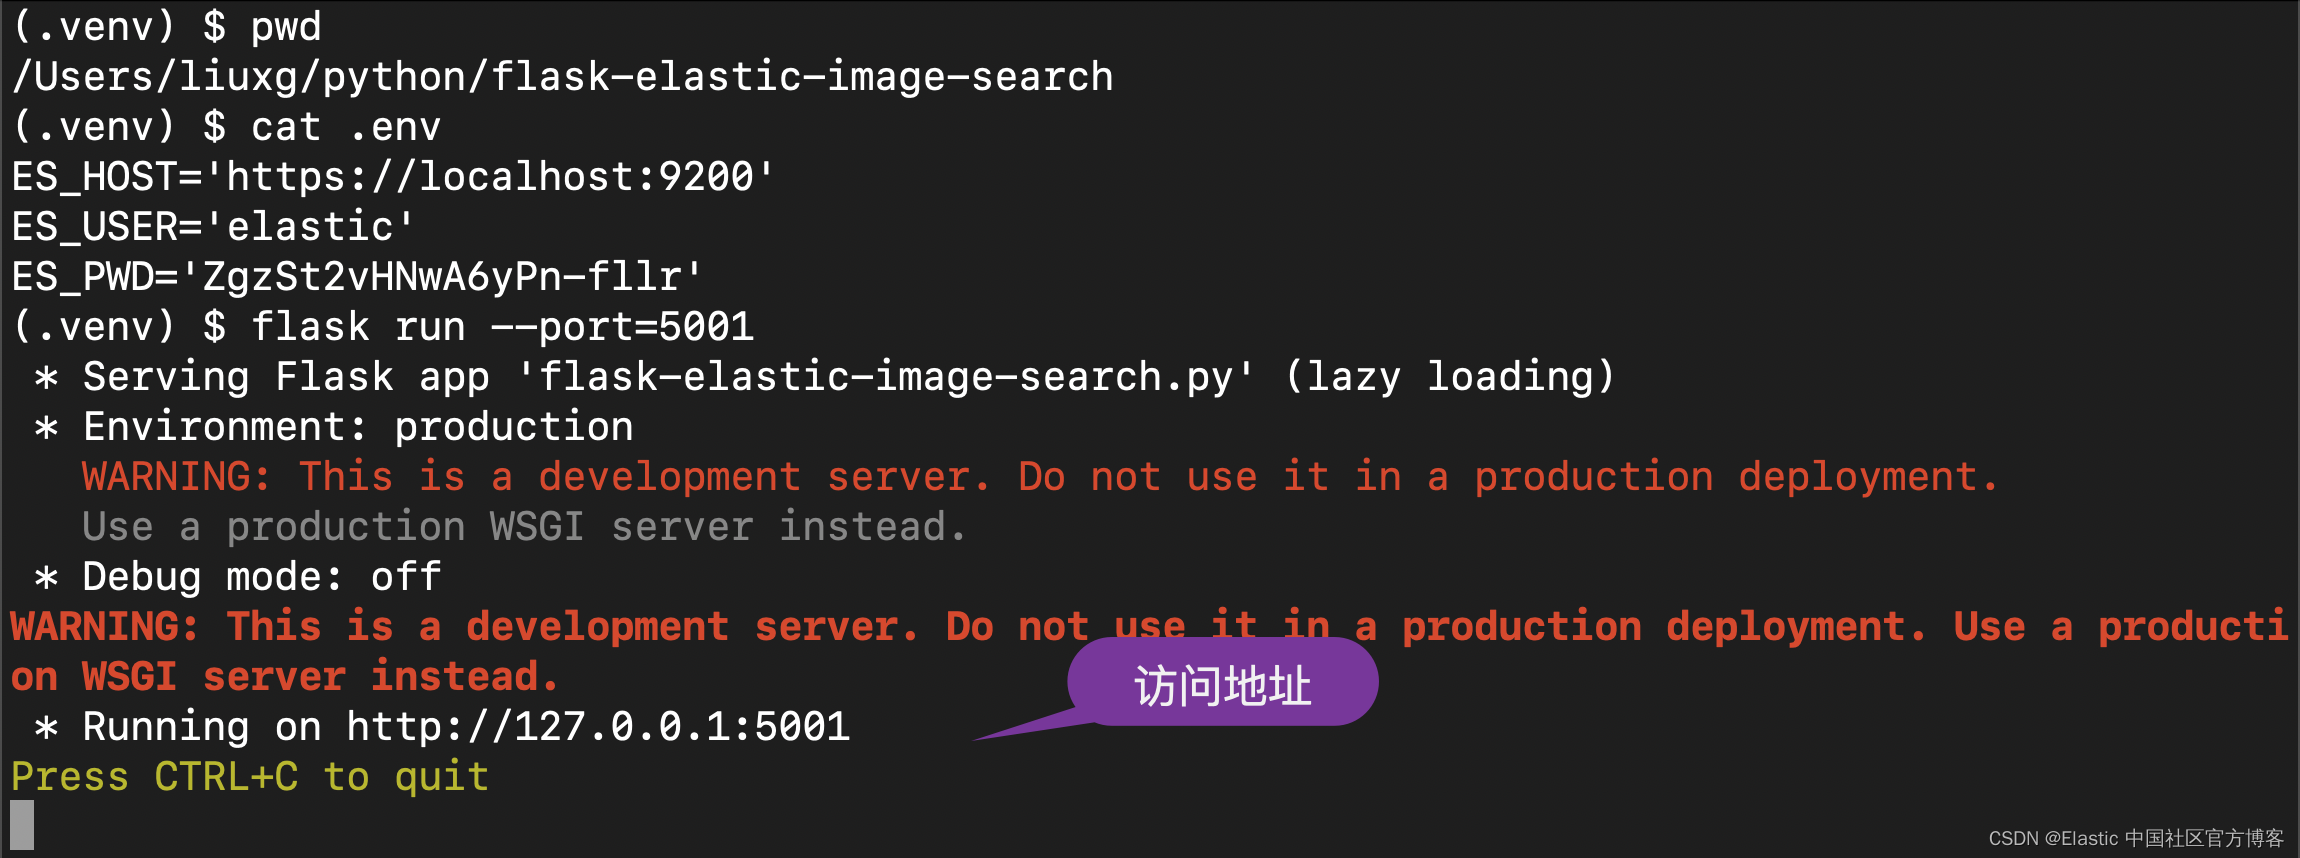
恭喜! 你的应用程序现在应该已启动并正在运行,并且可以通过互联网浏览器在 http://127.0.0.1:5001 上访问。
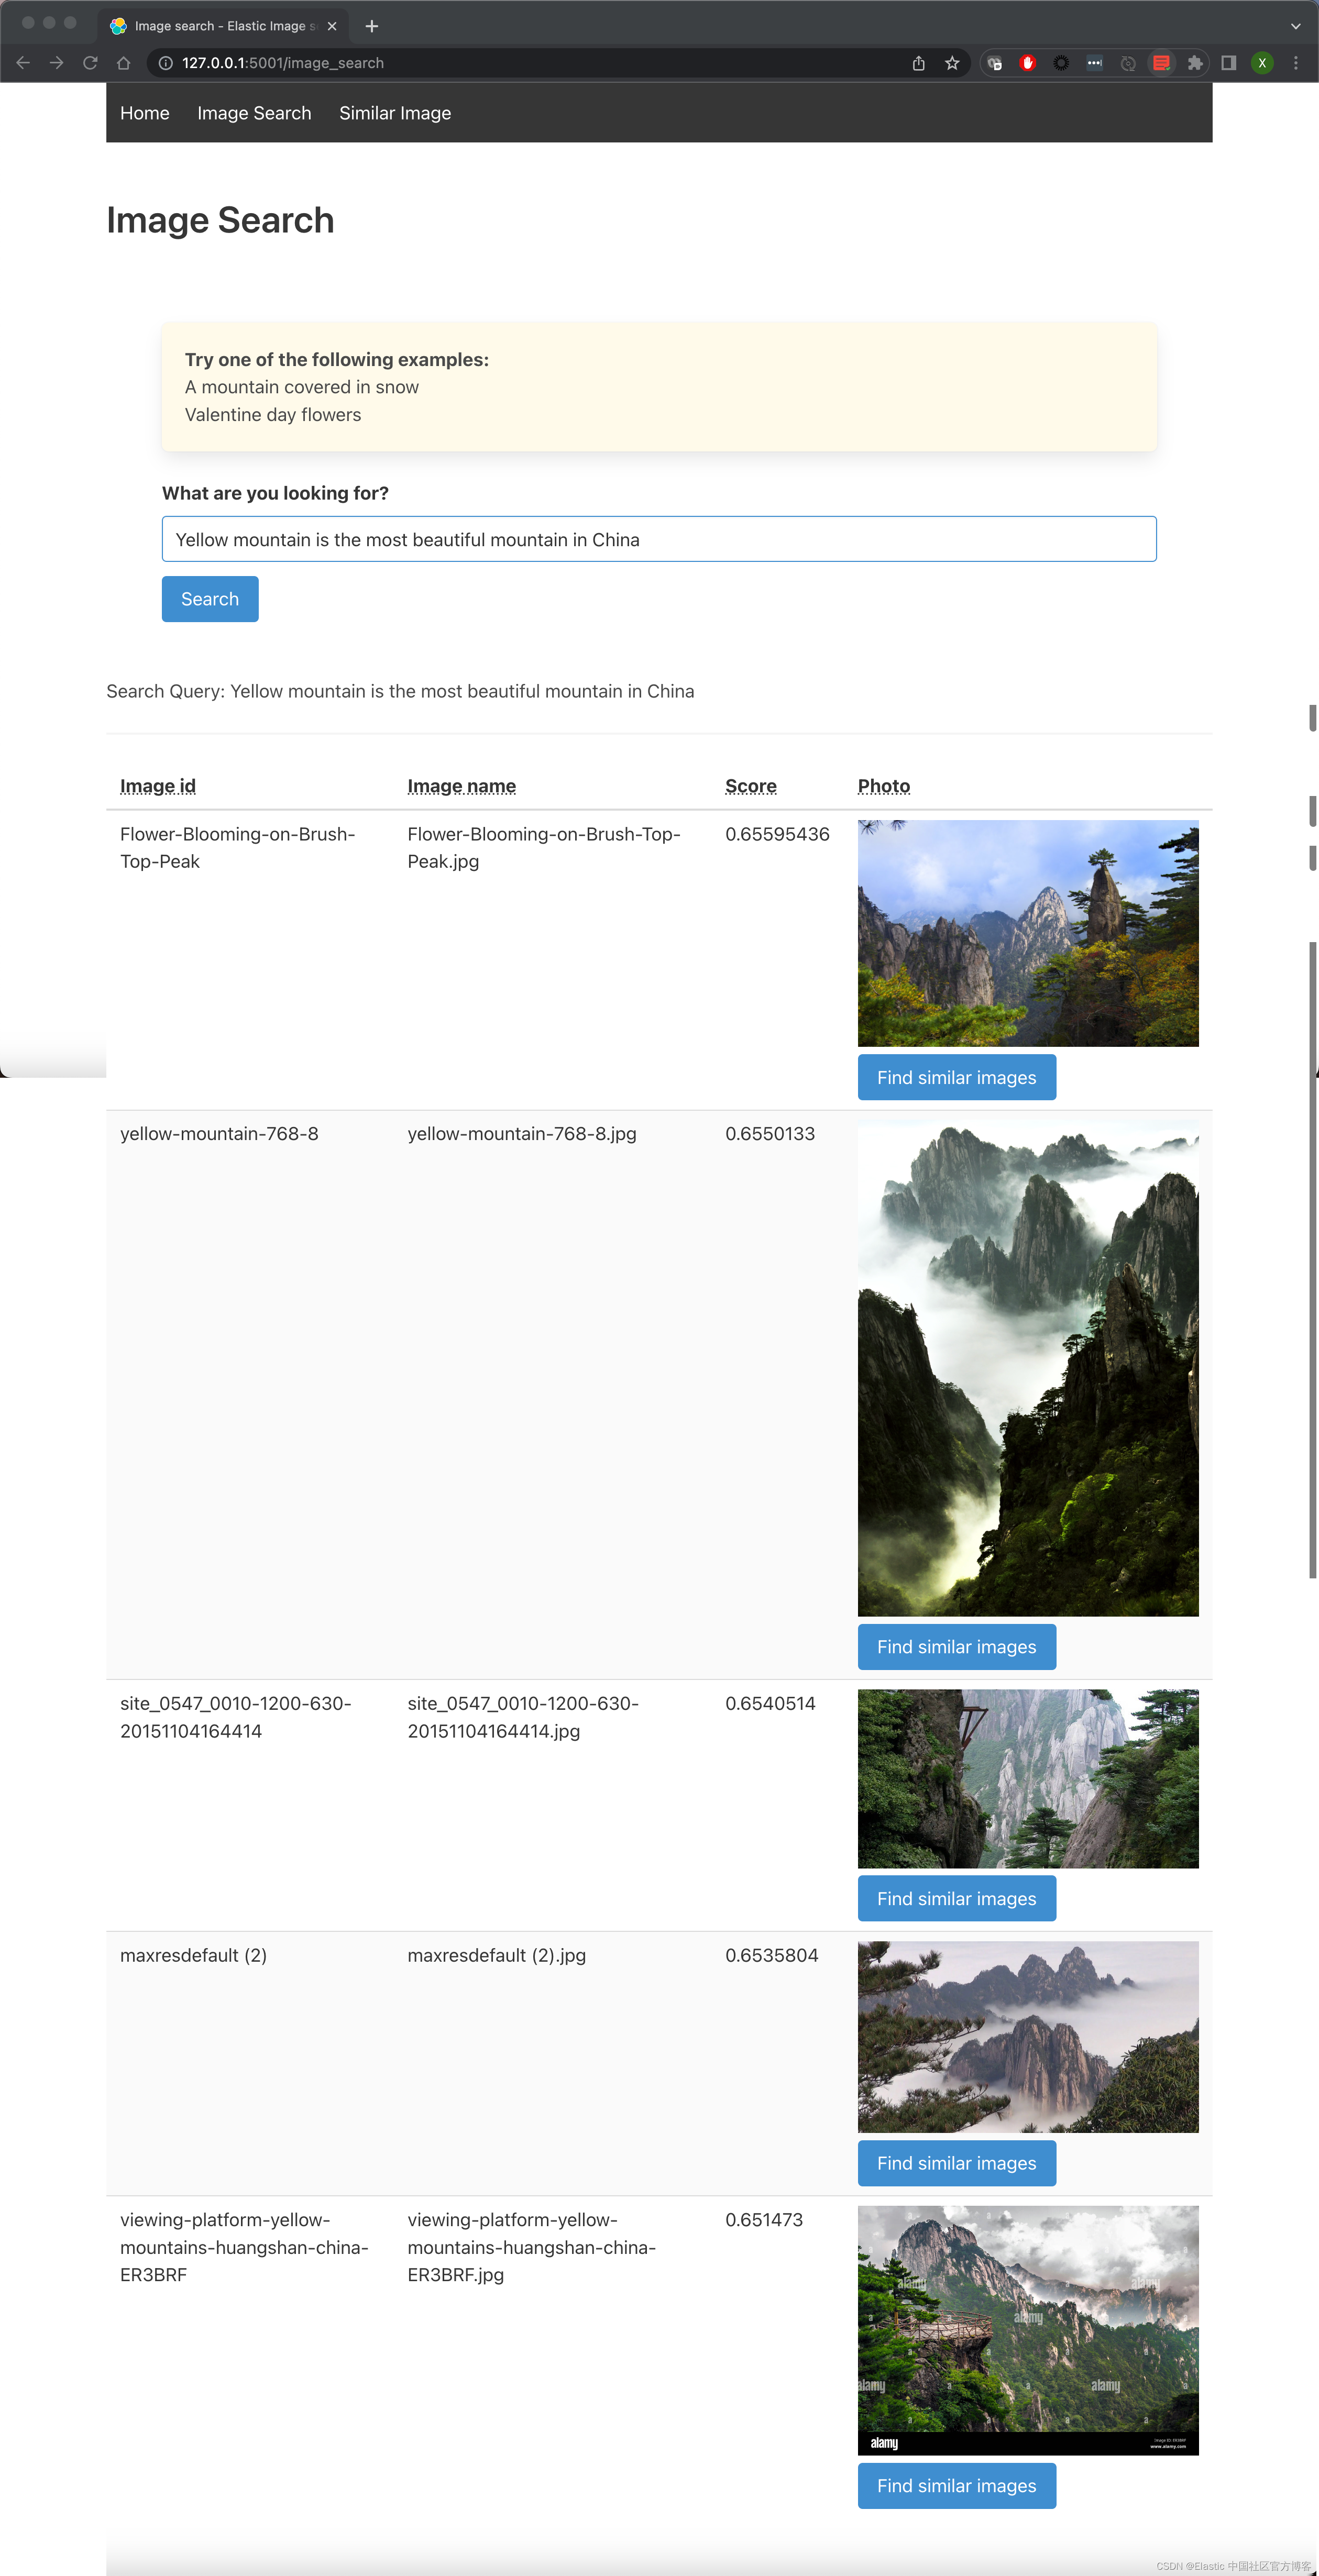
导航到图像搜索选项卡并输入描述你最佳图像的文本。 尝试使用非关键字或描述性文字。
在下面的示例中,输入的文本是 “Yellow mountain is the most beautiful mountain in China”。 结果显示在我们的数据集中。 如果用户喜欢结果集中的一张特定图像,只需单击它旁边的按钮,就会显示类似的图像。 用户可以无限次地这样做,并通过图像数据集构建自己的路径。
我们尝试另外的一个例子。这次我们输入:I love beautiful girls。
搜索也可以通过简单地上传图像来进行。 该应用程序会将图像转换为矢量并在数据集中搜索相似的图像。 为此,导航到第三个选项卡 “Similar Image”,从磁盘上传图像,然后点击 “Search”。
我们可以看到相似的图片。我们尝试使用一个女孩的照片再试试:
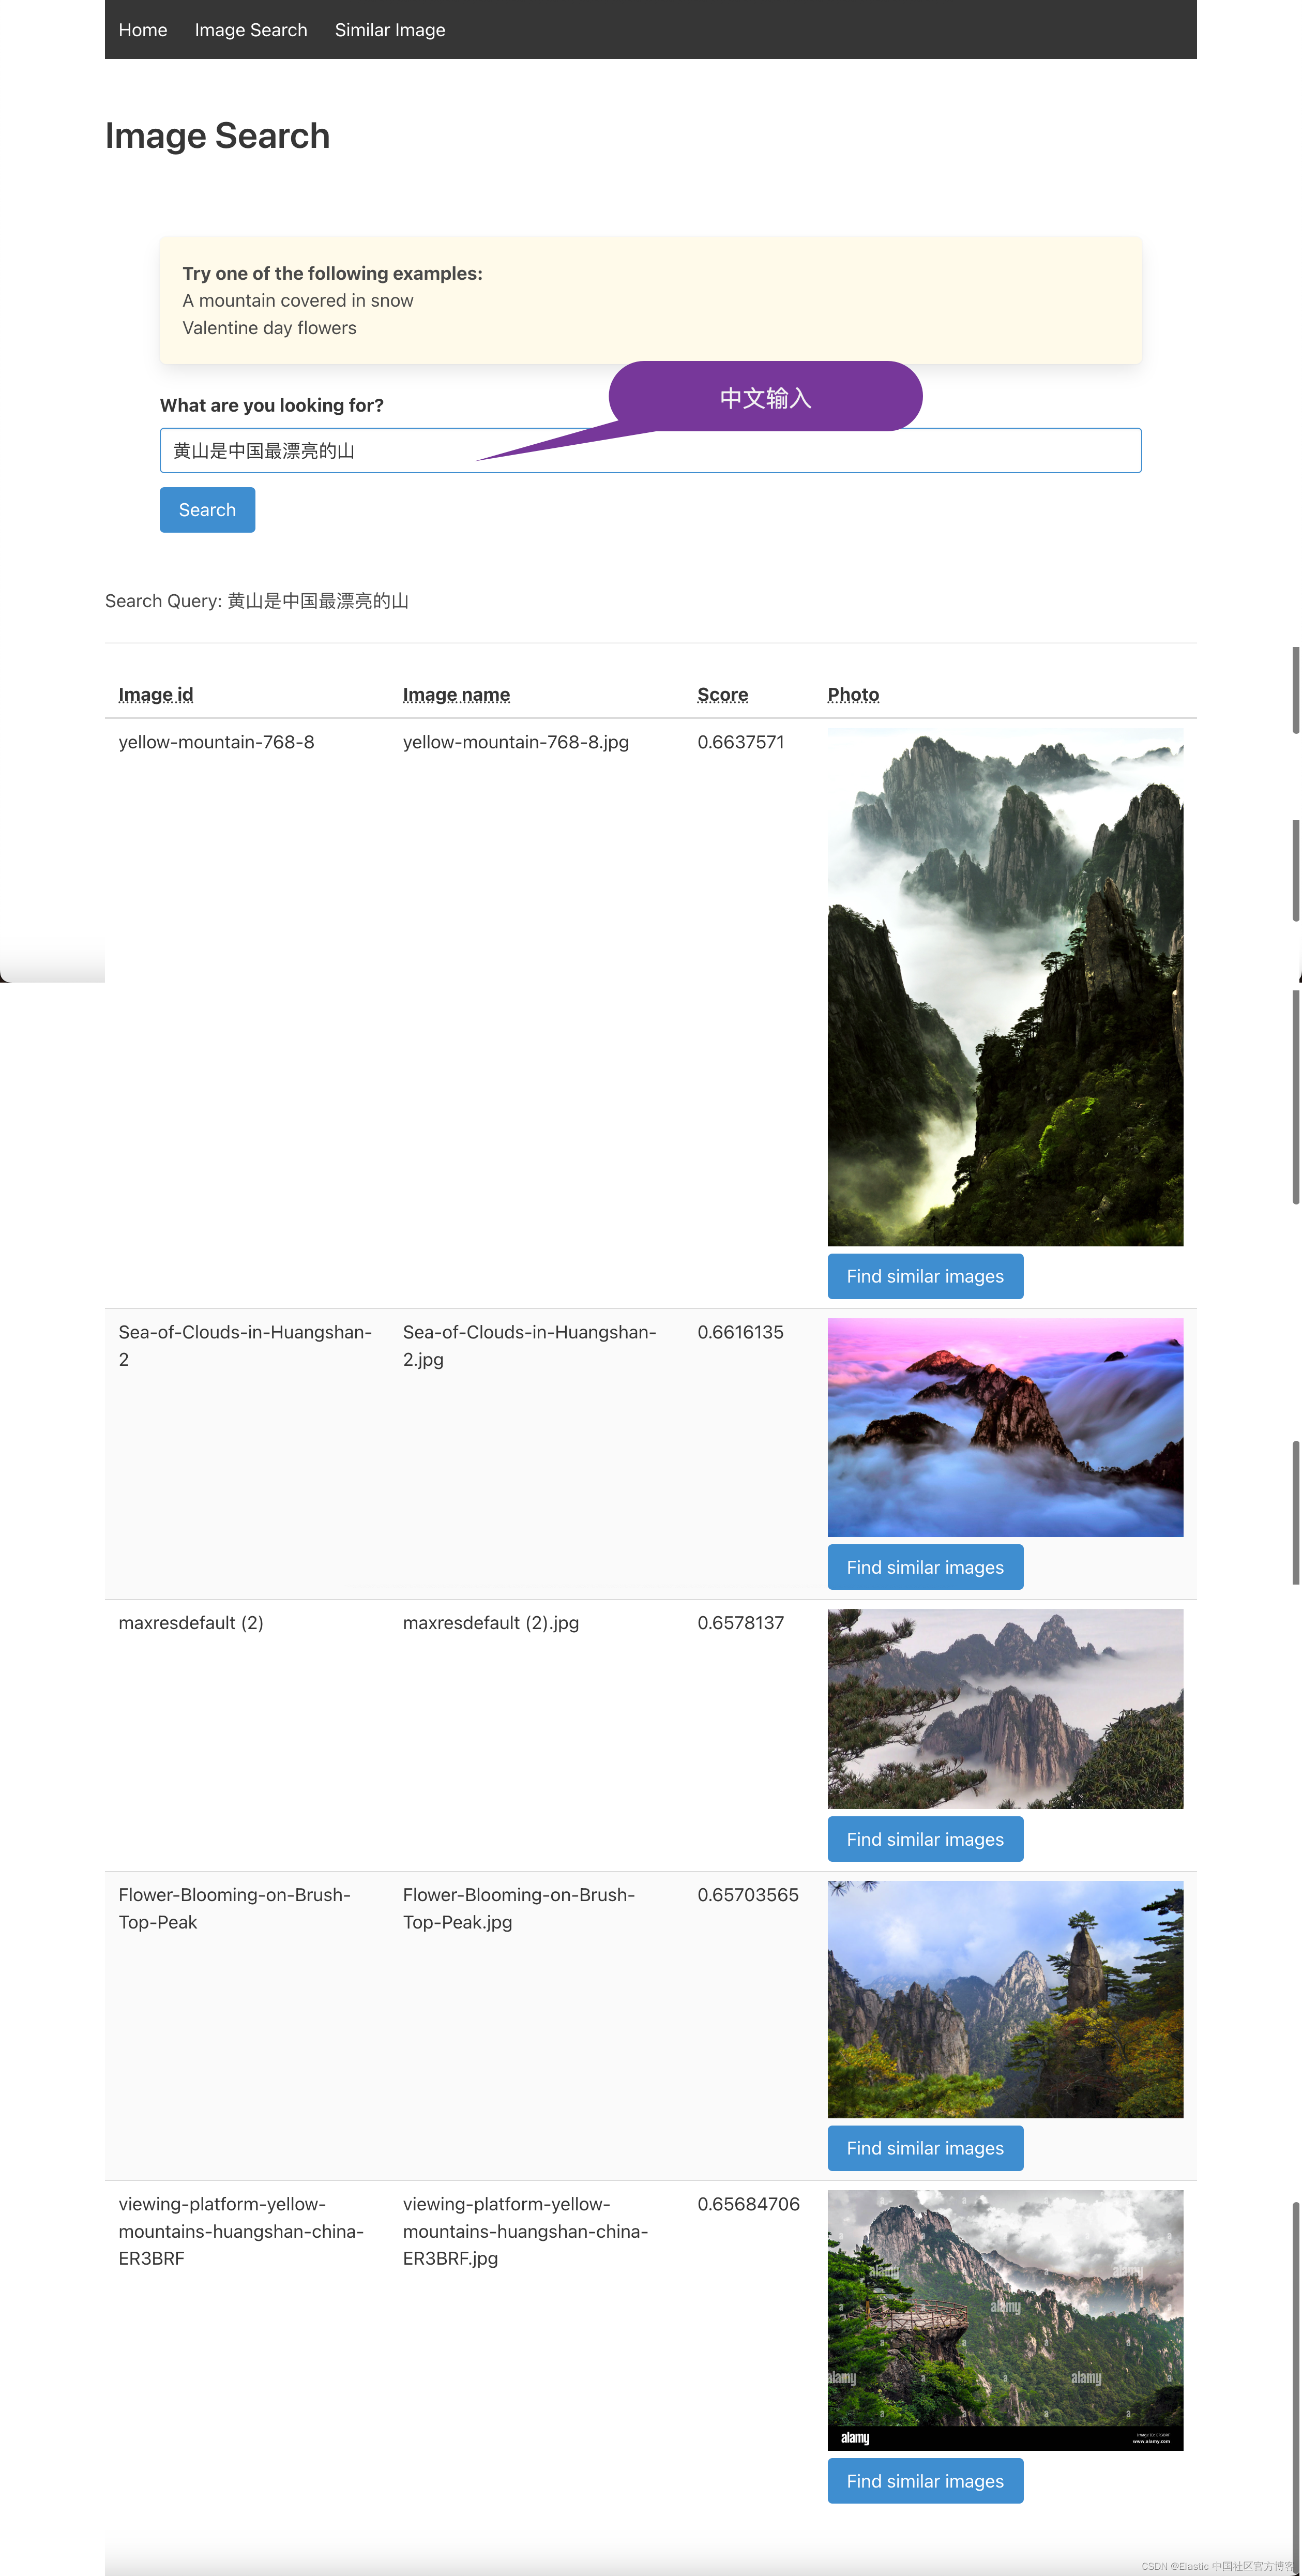
因为我们在 Elasticsearch 中使用的 NLP(sentence-transformers/clip-ViT-B-32-multilingual-v1)模型是多语言的,支持多语言推理,所以尽量搜索自己语言的图片。 然后也使用英文文本验证结果。我们尝试使用 “黄山是中国最漂亮的山”:
请务必注意,使用的模型是通用模型,这些模型非常准确,但你获得的结果会因用例或其他因素而异。 如果你需要更高的精度,则必须采用通用模型或开发自己的模型 —— CLIP 模型只是一个起点。
代码摘要
你可以在 GitHub 存储库中找到完整的代码。 你可能正在检查 routes.py 中的代码,它实现了应用程序的主要逻辑。 除了明显的路线定义之外,你还应该关注定义 _infer 和 _search 端点(infer_trained_model 和 knn_search_images)的方法。 生成图像嵌入的代码位于 create-image-embeddings.py文件中。
总结
现在你已经设置了 Flask 应用程序,你可以轻松地搜索你自己的图像集! Elastic 在平台内提供了矢量搜索的原生集成,避免了与外部进程的通信。 你可以灵活地开发和使用你可能使用 PyTorch 开发的自定义嵌入模型。
语义图像搜索具有其他传统图像搜索方法的以下优点:
- 更高的准确度:向量相似性捕获上下文和关联,而不依赖于图像的文本元描述。
- 增强的用户体验:与猜测哪些关键字可能相关相比,描述你正在寻找的内容或提供示例图像。
- 图像数据库的分类:不用担心对图像进行分类——相似性搜索可以在一堆图像中找到相关图像,而无需对它们进行组织。
如果你的用例更多地依赖于文本数据,你可以在以前的博客中了解更多关于实现语义搜索和将自然语言处理应用于文本的信息。 对于文本数据,向量相似度与传统关键词评分的结合呈现了两全其美的效果。
原文: Elasticsearch:如何在 Elastic 中实现图片相似度搜索
在本文章,我们将了解如何通过几个步骤在 Elastic 中实施相似图像搜索。 开始设置应用程序环境,然后导入 NLP 模型,最后完成为你的图像集生成嵌入。
Elasticsearch:如何在 Elastic 中实现图片相似度搜索
如何设置环境
第一步是为你的应用程序设置环境。 一般要求包括:
- Git
- Python 3.9
- Docker
- 数百张图片
使用数百张图像以确保获得最佳效果非常重要。
转到工作文件夹并检查创建的存储库代码。 然后导航到存储库文件夹。
1.  git clone https://github.com/radoondas/flask-elastic-image-search.git
2.  cd flask-elastic-image-search
1.  $ git clone https://github.com/radoondas/flask-elastic-image-search.git
2.  Cloning into 'flask-elastic-image-search'...
3.  remote: Enumerating objects: 105, done.
4.  remote: Counting objects: 100% (105/105), done.
5.  remote: Compressing objects: 100% (72/72), done.
6.  remote: Total 105 (delta 37), reused 94 (delta 27), pack-reused 0
7.  Receiving objects: 100% (105/105), 20.72 MiB | 9.75 MiB/s, done.
8.  Resolving deltas: 100% (37/37), done.
9.  $ cd flask-elastic-image-search/
10.  $ pwd
11.  /Users/liuxg/python/flask-elastic-image-search
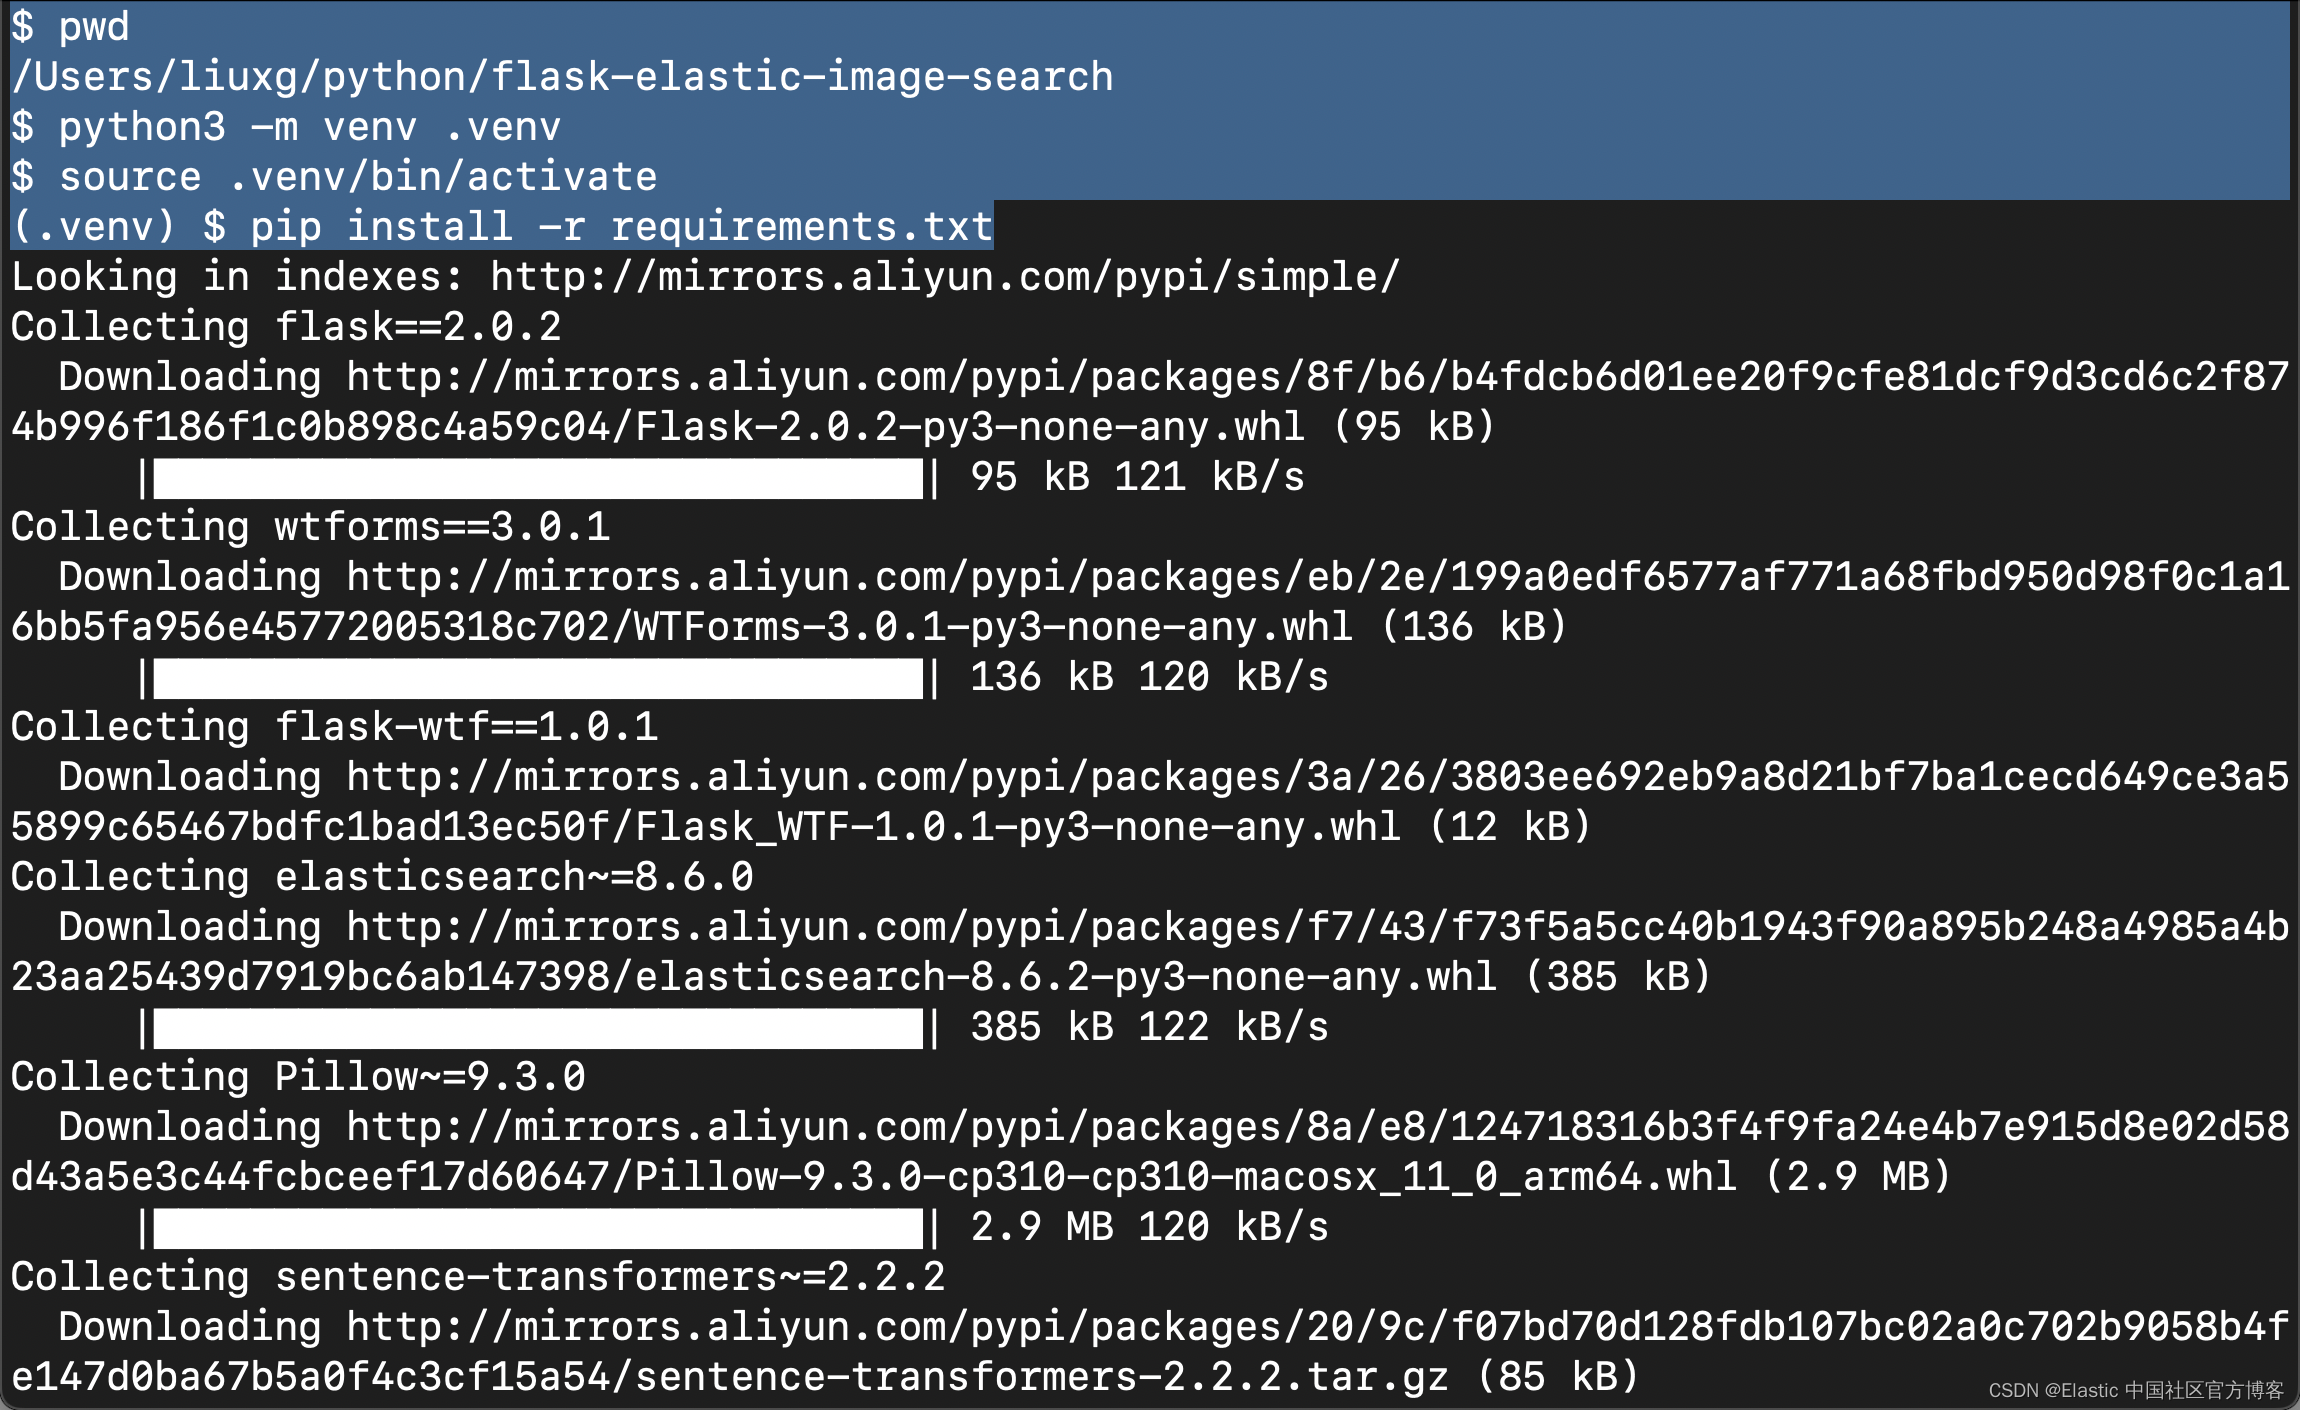
因为你将使用 Python 来运行代码,所以你需要确保满足所有要求并且环境已准备就绪。 现在创建虚拟环境并安装所有依赖项。
1.  python3 -m venv .venv
2.  source .venv/bin/activate
3.  pip install -r requirements.txt
安装
如果你还没有安装好自己的 Elasticsearch 及 Kibana,请参考如下的文章来进行安装:
特别注意的是:我们将以最新的 Elastic Stack 8.6.1 来进行展示。请参考 Elastic Stack 8.x 的文章进行安装。
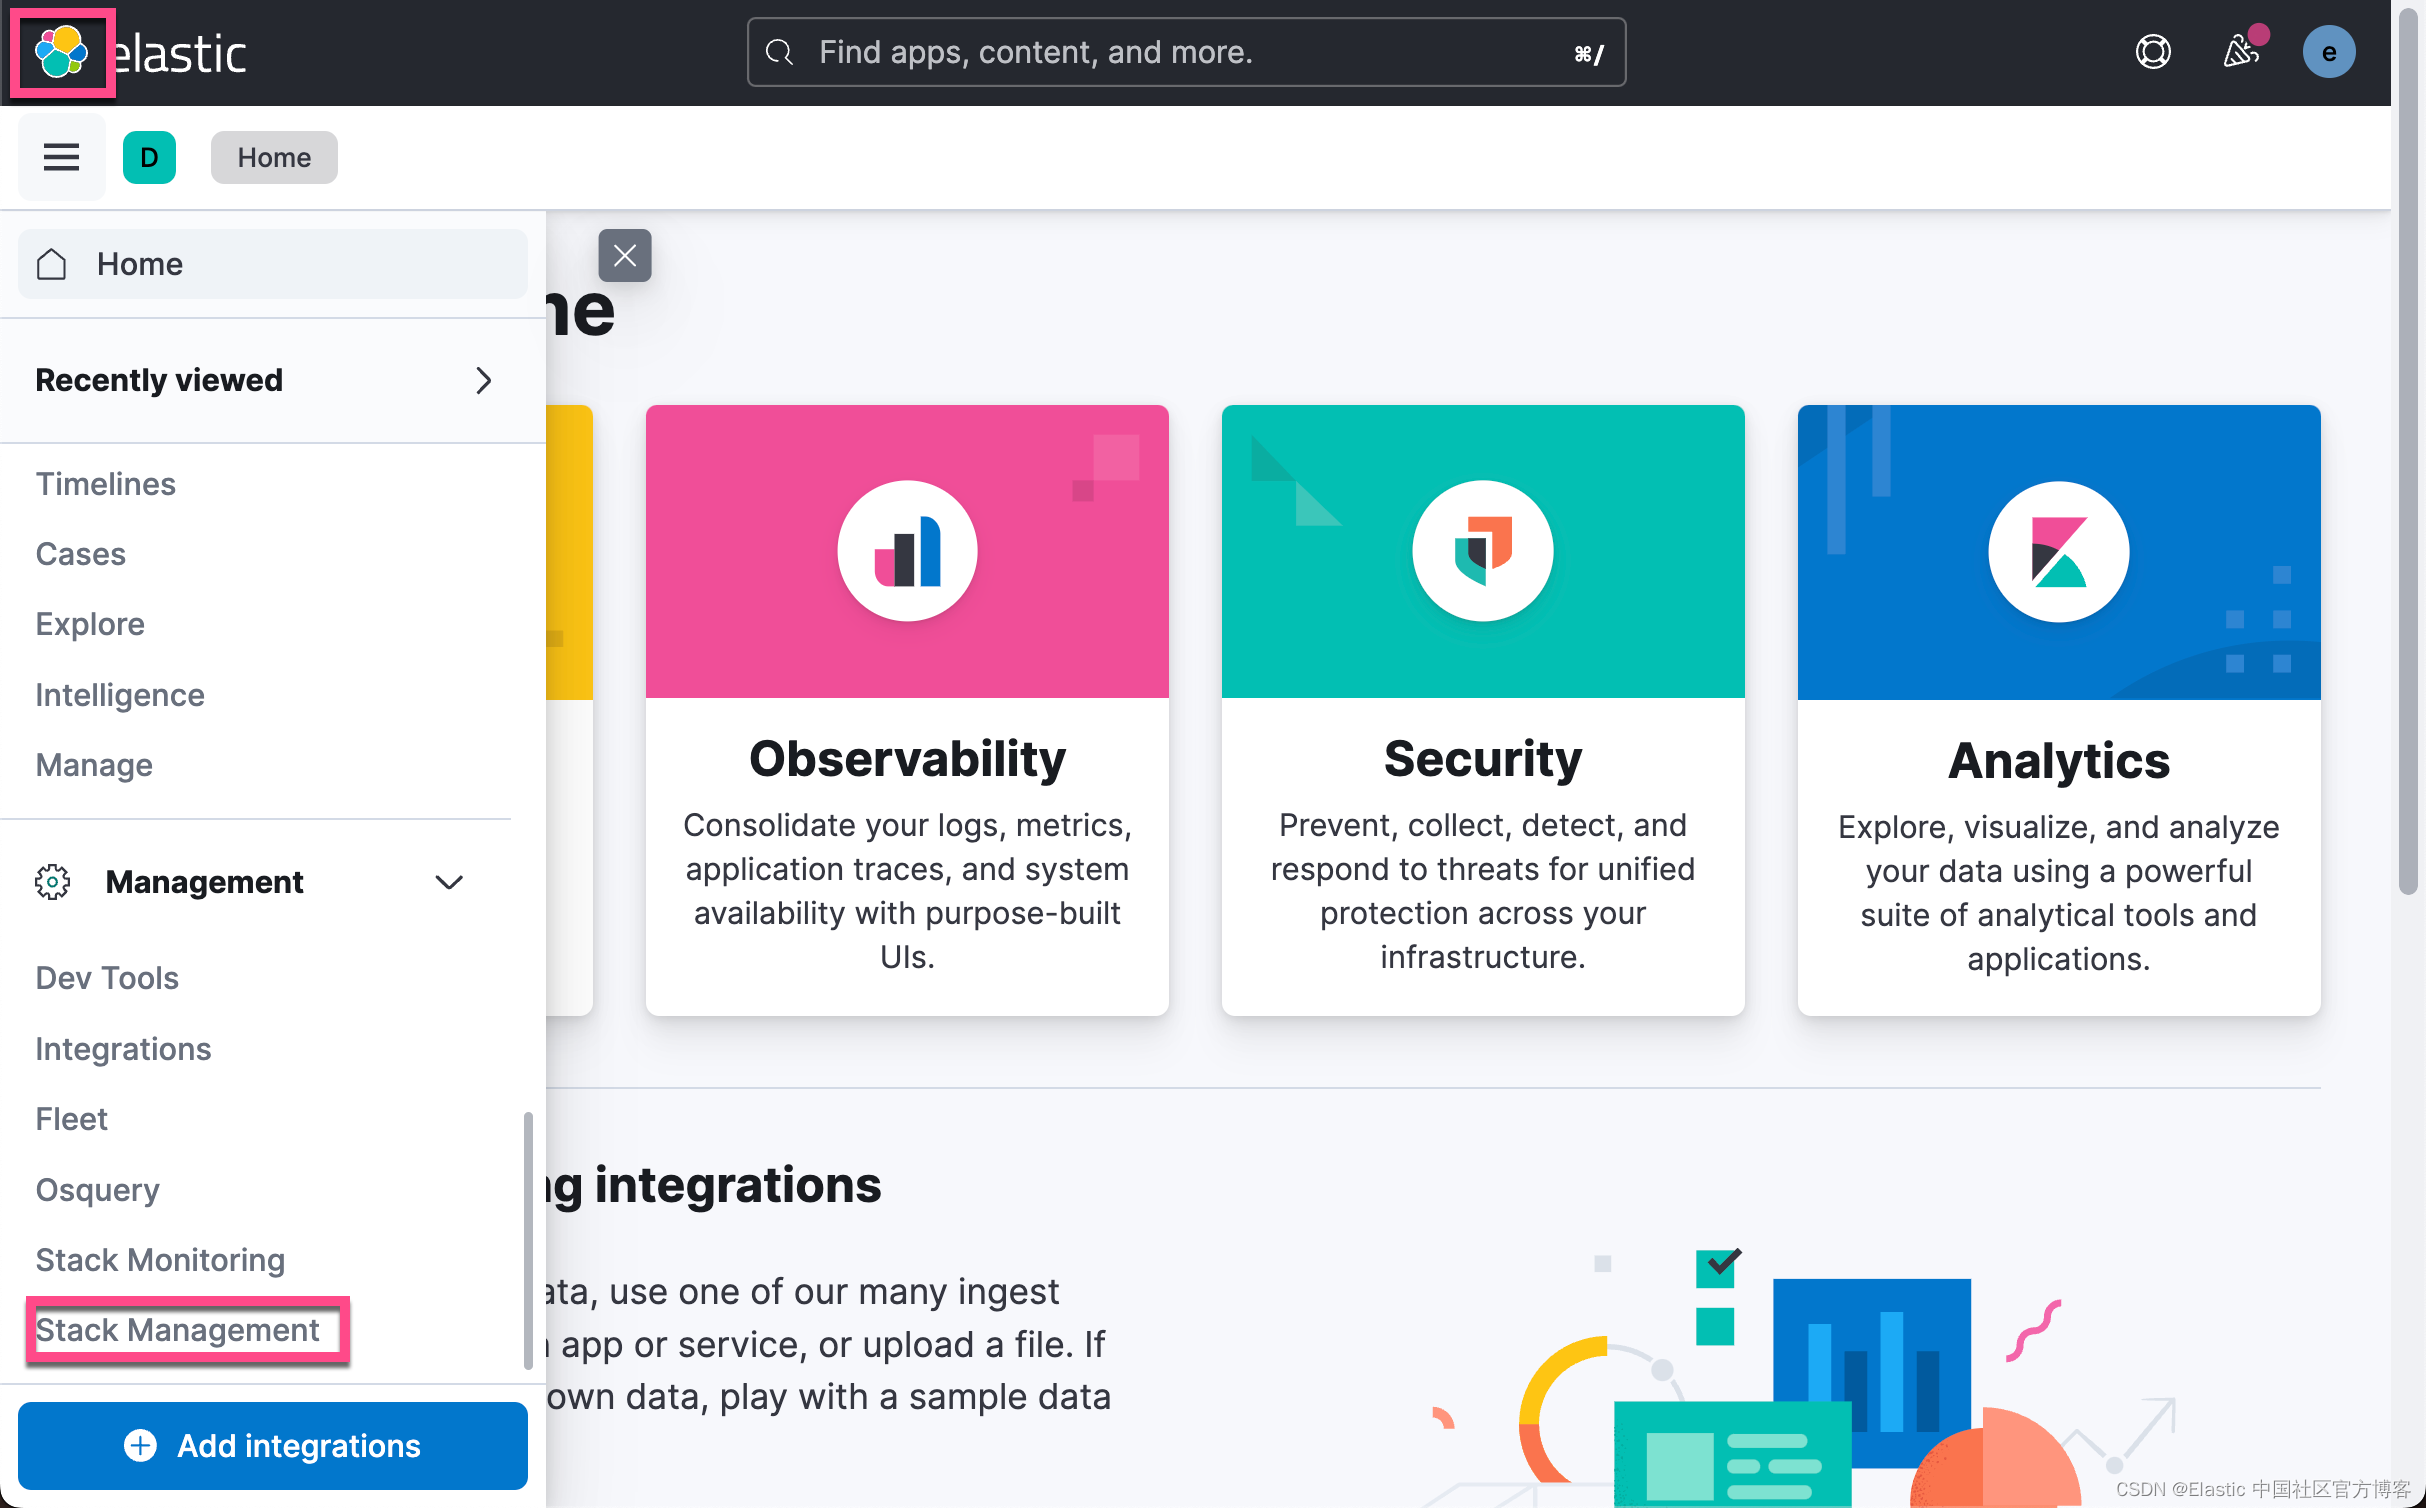
启动白金版试用功能
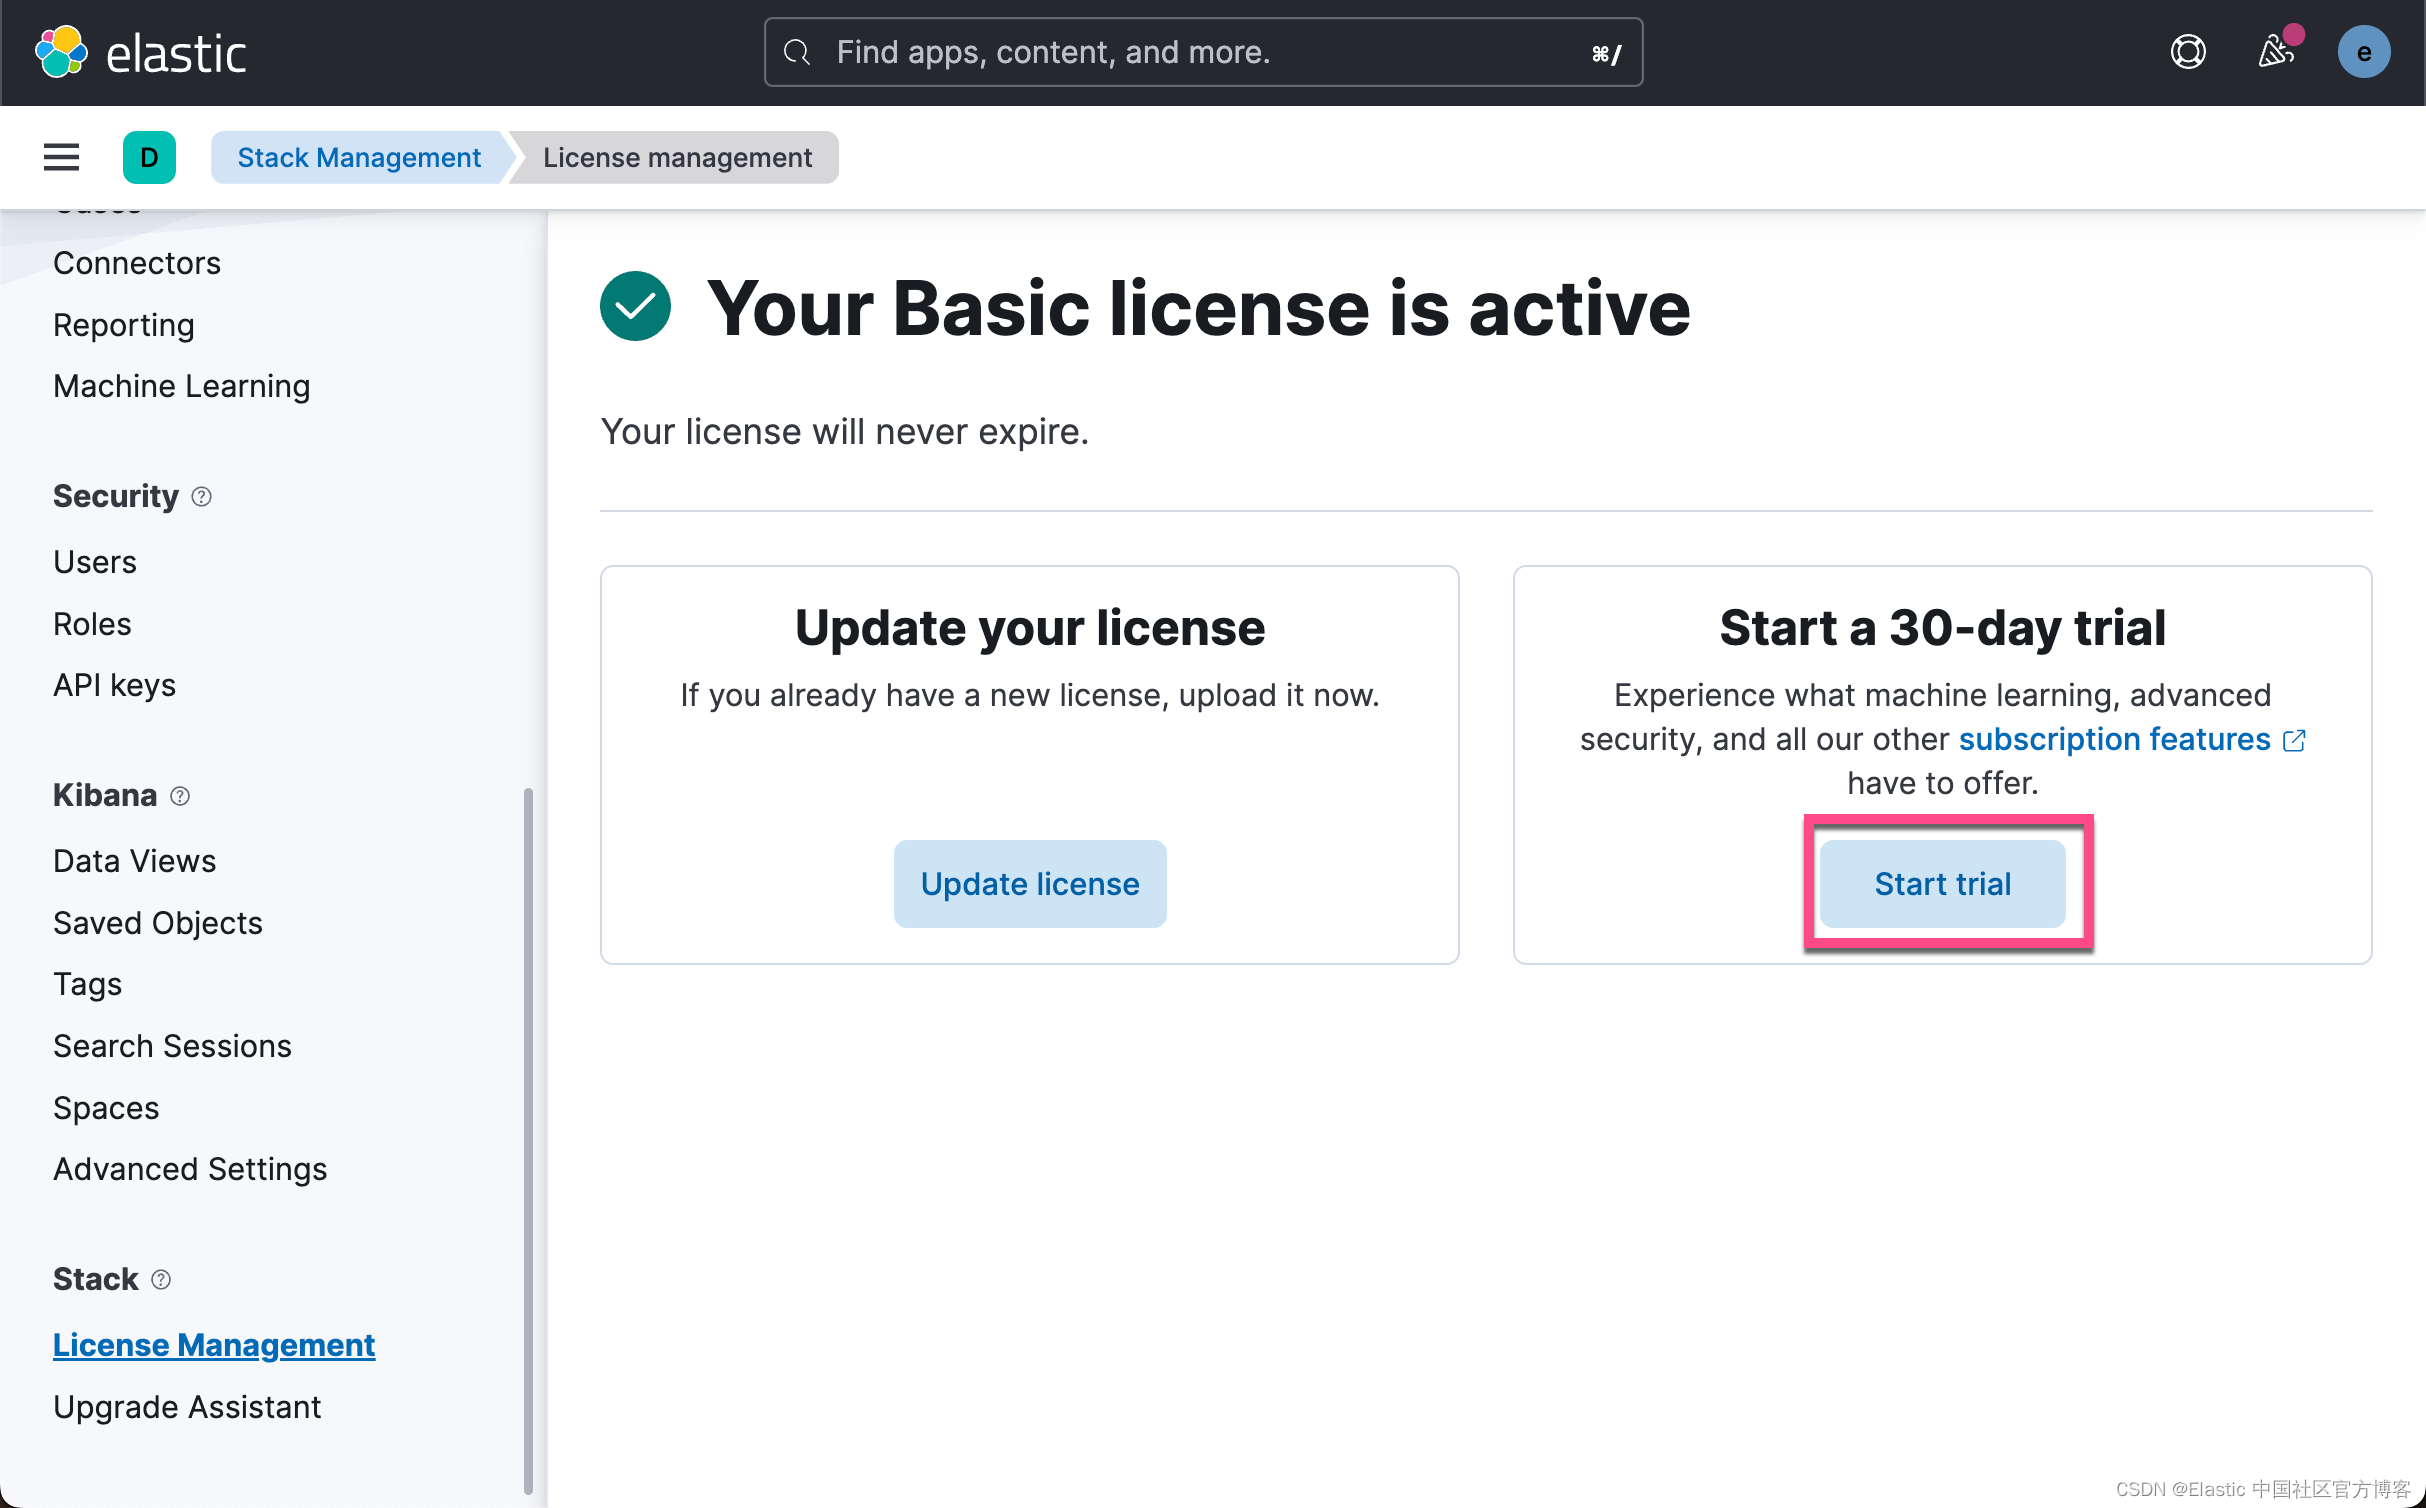
由于上传模型是一个白金版的功能,我们需要启动试用功能。更多关于订阅的信息,请参考网址:订阅 | Elastic Stack 产品和支持 | Elastic。
这样我们就成功地启动了白金版试用功能。
Elasticsearch 集群和嵌入模型
登录到你的帐户以启动 Elasticsearch 集群。 设置一个小型集群:
- 一个具有 2GB 内存的 HOT 节点
- 一个具有 4GB 内存的 ML(机器学习)节点(此节点的大小很重要,因为你将导入 Elasticsearch 的 NLP 模型会消耗约 1.5GB 的内存。)
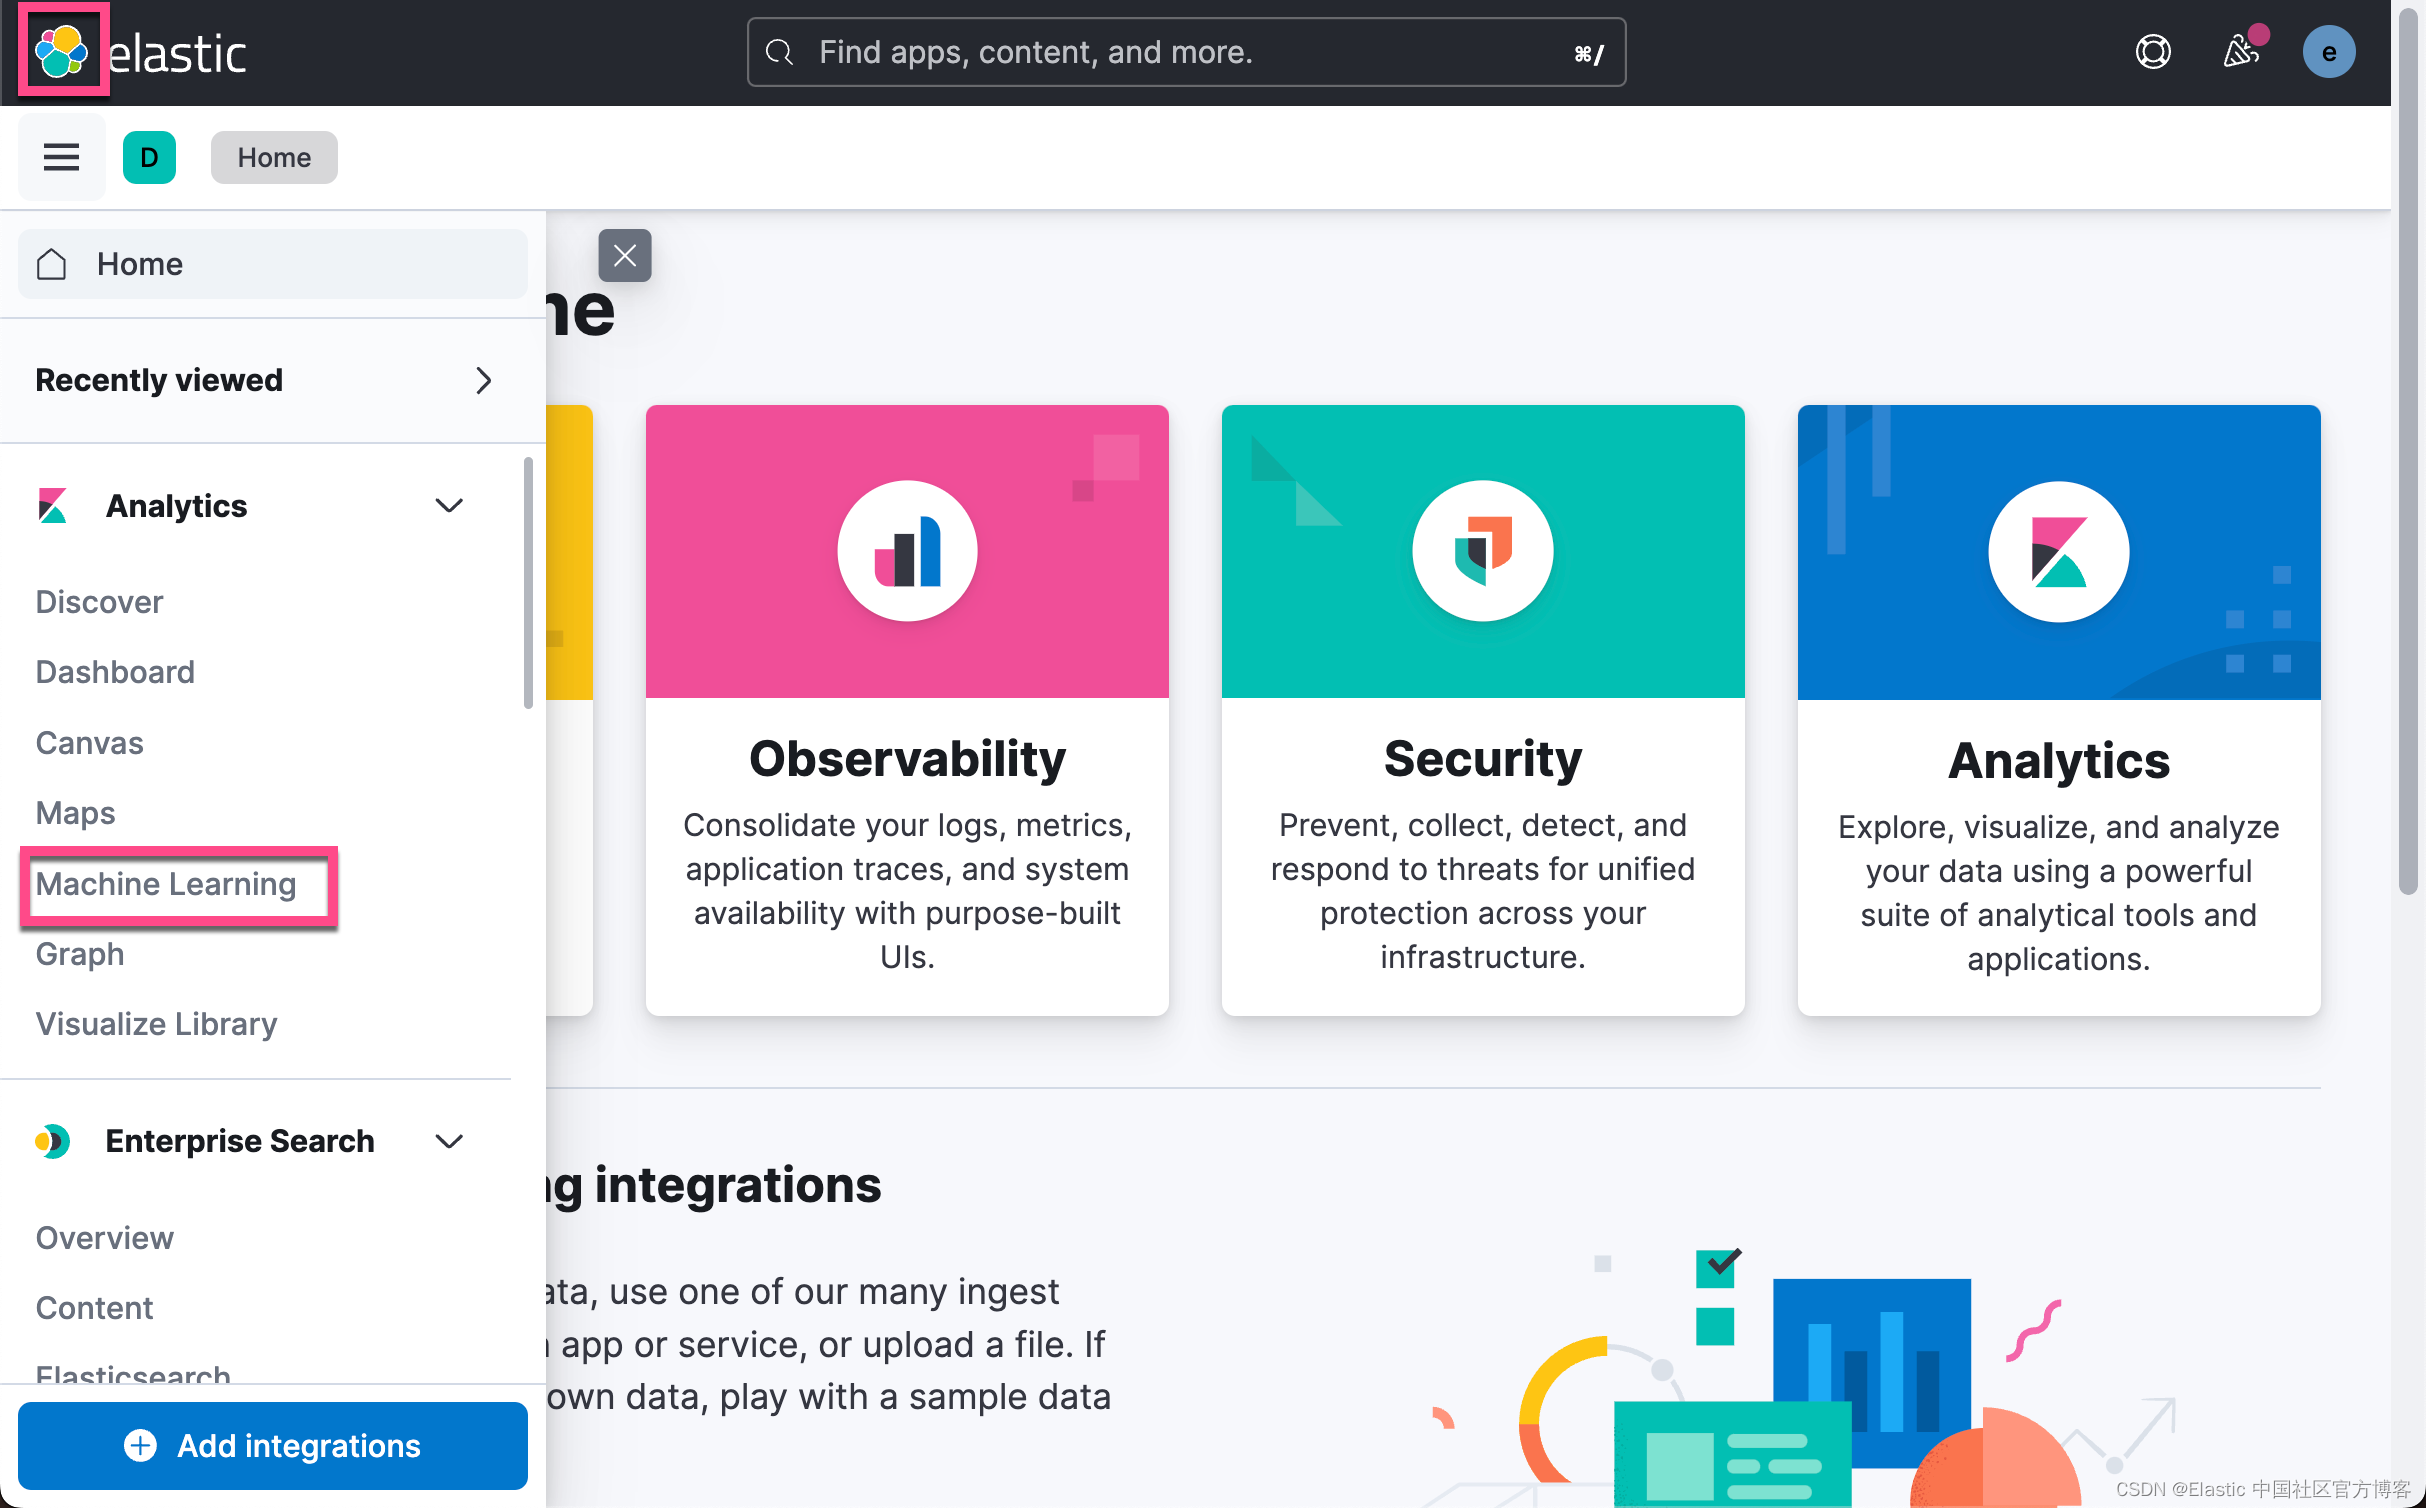
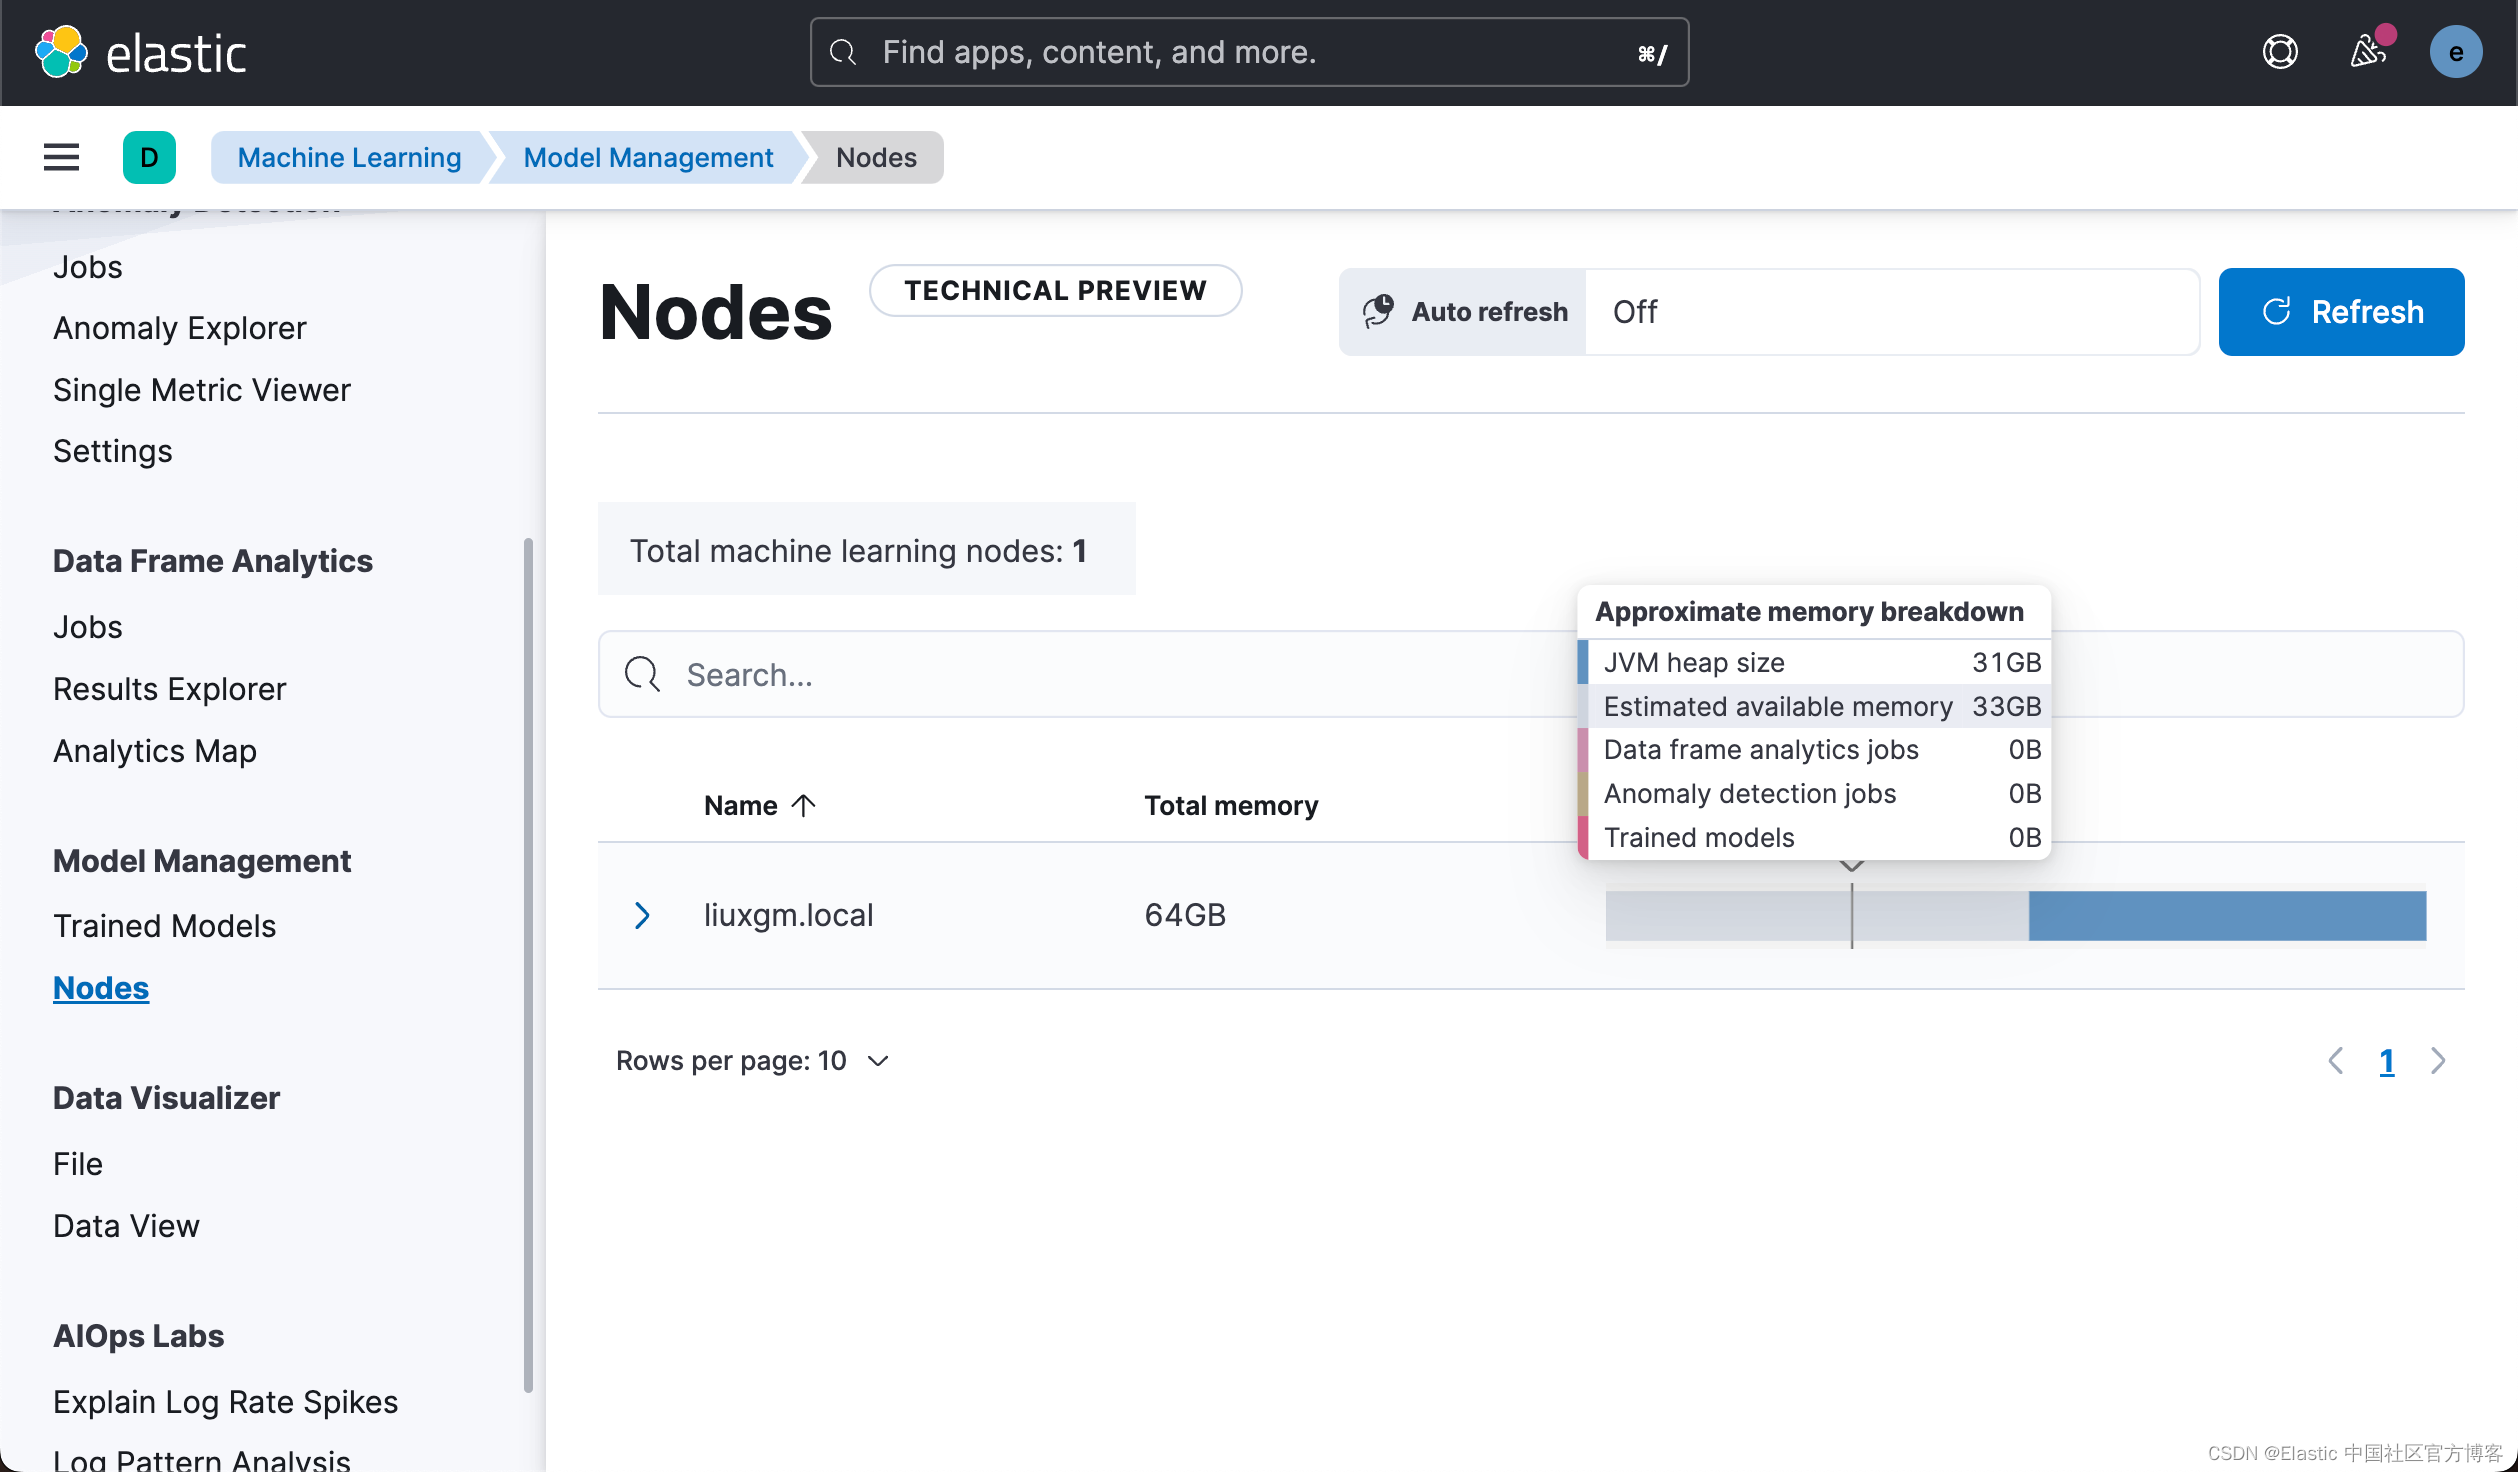
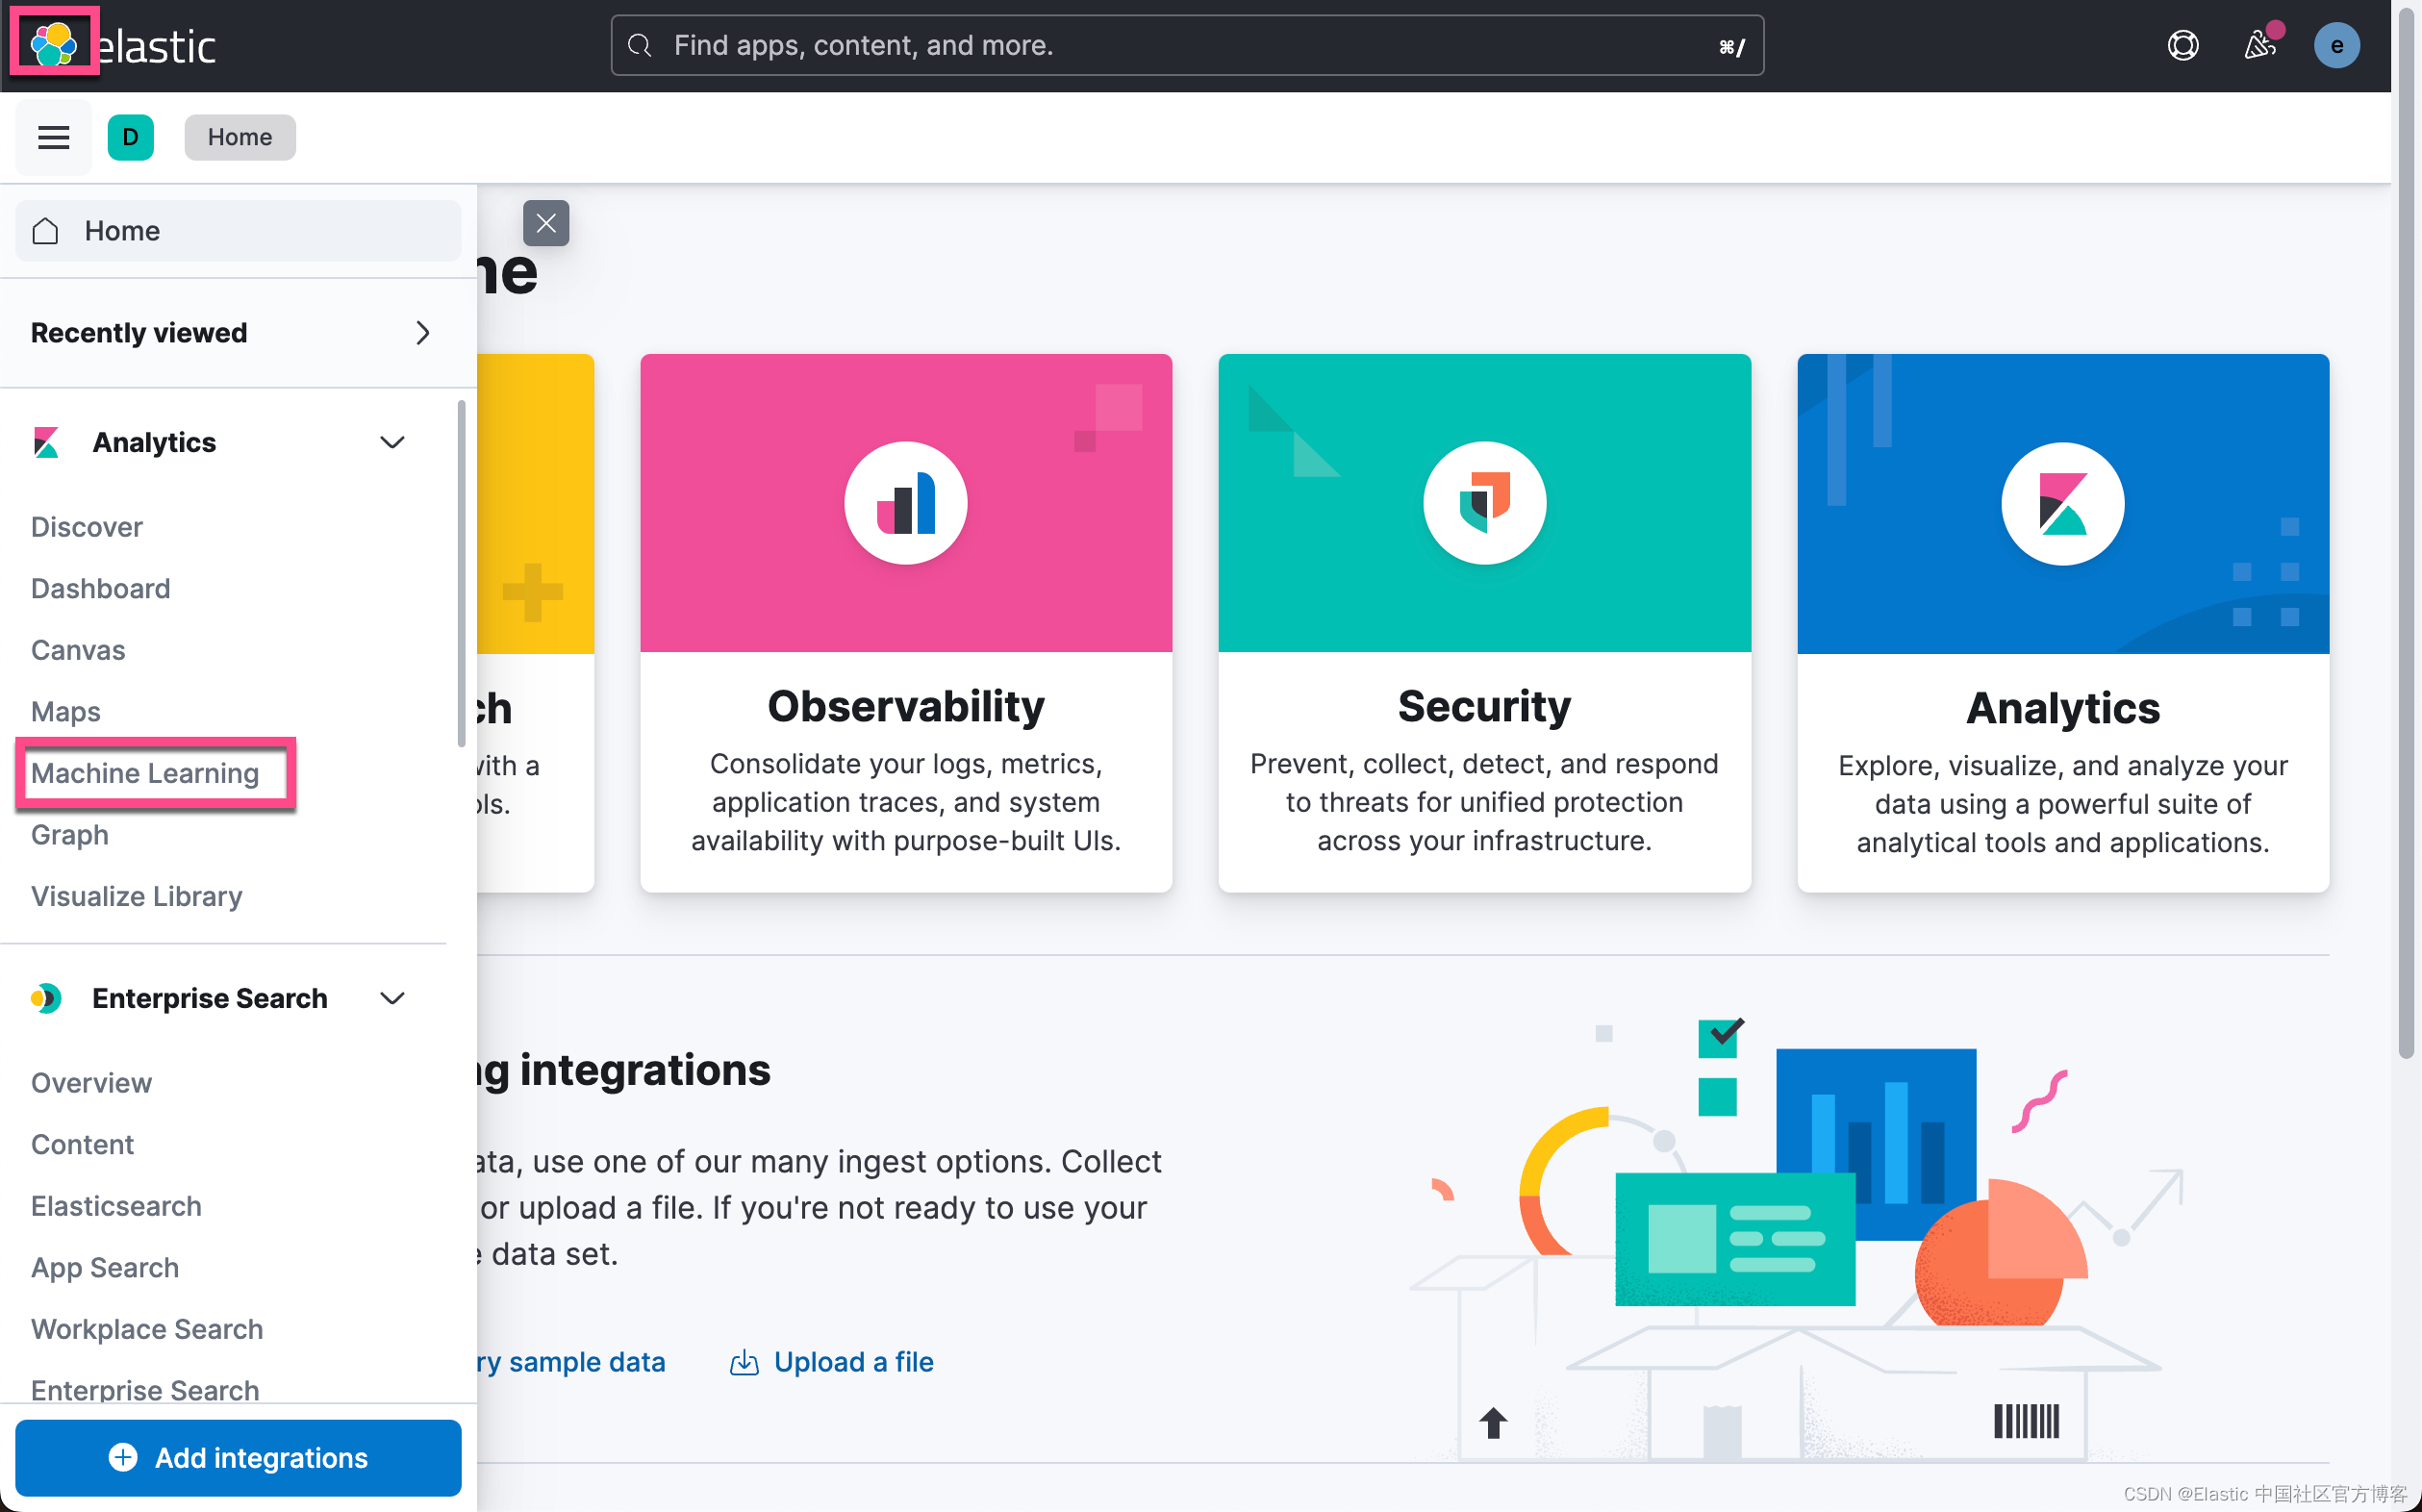
部署准备就绪后,转到 Kibana 并检查机器学习节点的容量。 你将在视图中看到一个机器学习节点。 目前没有加载模型。
使用 Eland 库从 OpenAI 上传 CLIP 嵌入模型。 Eland 是一个 Python Elasticsearch 客户端,用于在 Elasticsearch 中探索和分析数据,能够处理文本和图像。 您将使用此模型从文本输入生成嵌入并查询匹配图像。 在 Eland 库的文档中找到更多详细信息。
对于下一步,你将需要 Elasticsearch 端点。 你可以从部署详细信息部分的 Elasticsearch 云控制台获取它。
在本示例中,我们将使用本地部署来进行展示,所以,我们并不必要完成上面的步骤。
Eland
Eland 可以通过 pip 从 PyPI 安装。在安装之前,我们需要安装好自己的 Python。
1.  $ python --version
2.  Python 3.10.2
可以使用 Pip 从 PyPI 安装 Eland:
python -m pip install eland也可以使用 Conda 从 Conda Forge 安装 Eland:
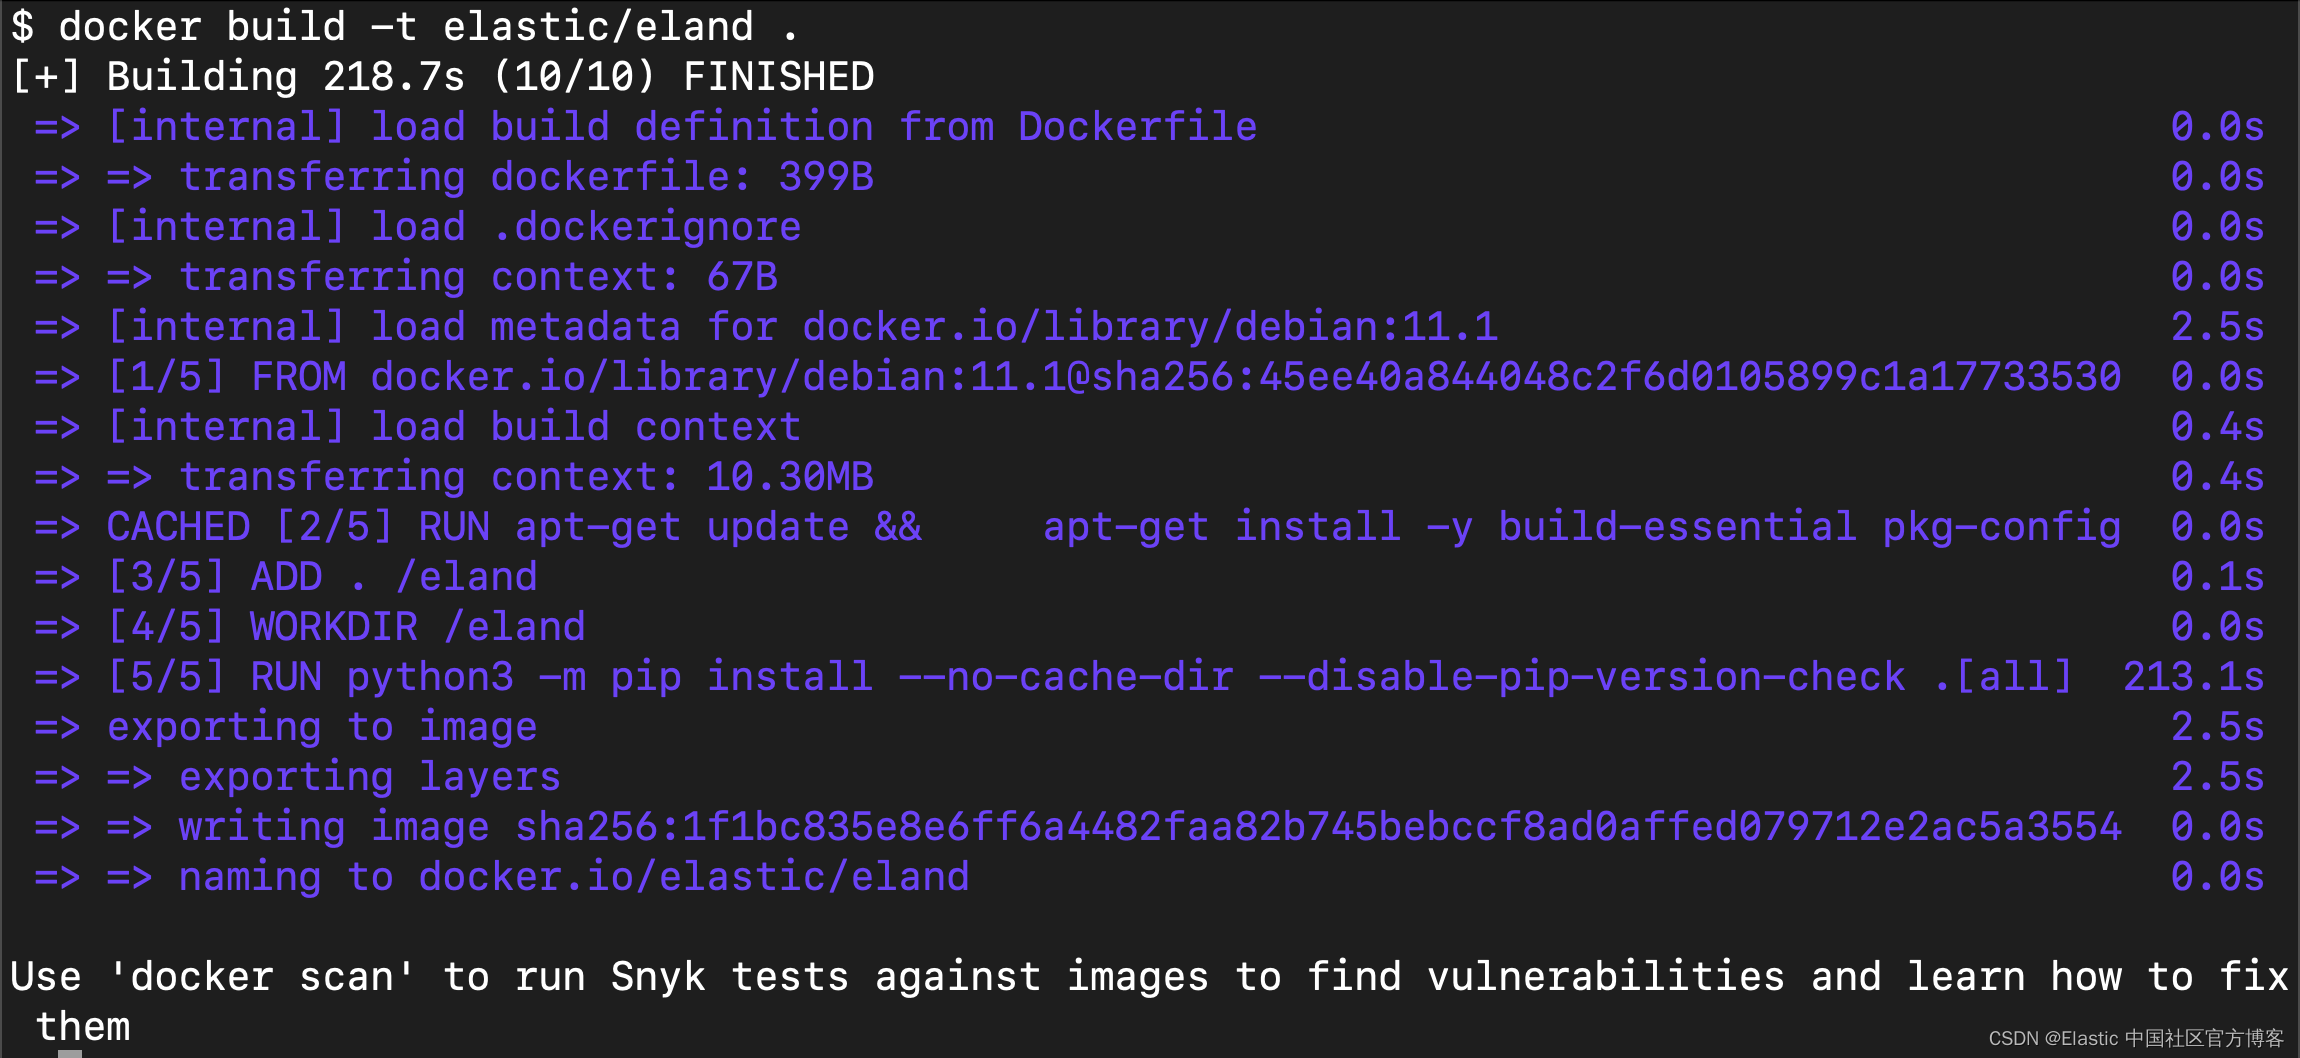
conda install -c conda-forge eland希望在不安装 Eland 的情况下使用它的用户,为了只运行可用的脚本,可以构建 Docker 容器:
1.  git clone https://github.com/elastic/eland
2.  cd eland
3.  docker build -t elastic/eland .
Eland 将 Hugging Face 转换器模型到其 TorchScript 表示的转换和分块过程封装在一个 Python 方法中; 因此,这是推荐的导入方法。
- 安装 Eland Python 客户端。
- 运行 eland_import_hub_model 脚本。 例如:
1.  eland_import_hub_model --url <clusterUrl> \
2.  --hub-model-id elastic/distilbert-base-cased-finetuned-conll03-english \
3. --task-type ner - 指定 URL 以访问你的集群。 例如,https://user>:
@ 。 - 在 Hugging Face 模型中心中指定模型的标识符。
- 指定 NLP 任务的类型。 支持的值为 fill_mask、ner、text_classification、text_embedding, question_answering 和 zero_shot_classification。
上传模型
我们使用如下的命令来进行上传模型:
1.  eland_import_hub_model --url https://<user>:<password>@<hostname>:<port> \
2.    --hub-model-id sentence-transformers/clip-ViT-B-32-multilingual-v1 \
3.    --task-type text_embedding \
4.    --ca-certs <your certificate> \
5.    --start
针对我的情况:
1.  eland_import_hub_model --url https://elastic:ZgzSt2vHNwA6yPn-fllr@localhost:9200 \
2.    --hub-model-id sentence-transformers/clip-ViT-B-32-multilingual-v1 \
3.    --task-type text_embedding \
4.    --ca-certs /Users/liuxg/elastic/elasticsearch-8.6.1/config/certs/http_ca.crt \
5.    --start
请注意: 你需要根据自己的 Elasticsearch 访问端点,用户名及密码来修改上面的设置,同时你需要根据自己的配置修改上面的证书路径。
运行上面的命令:
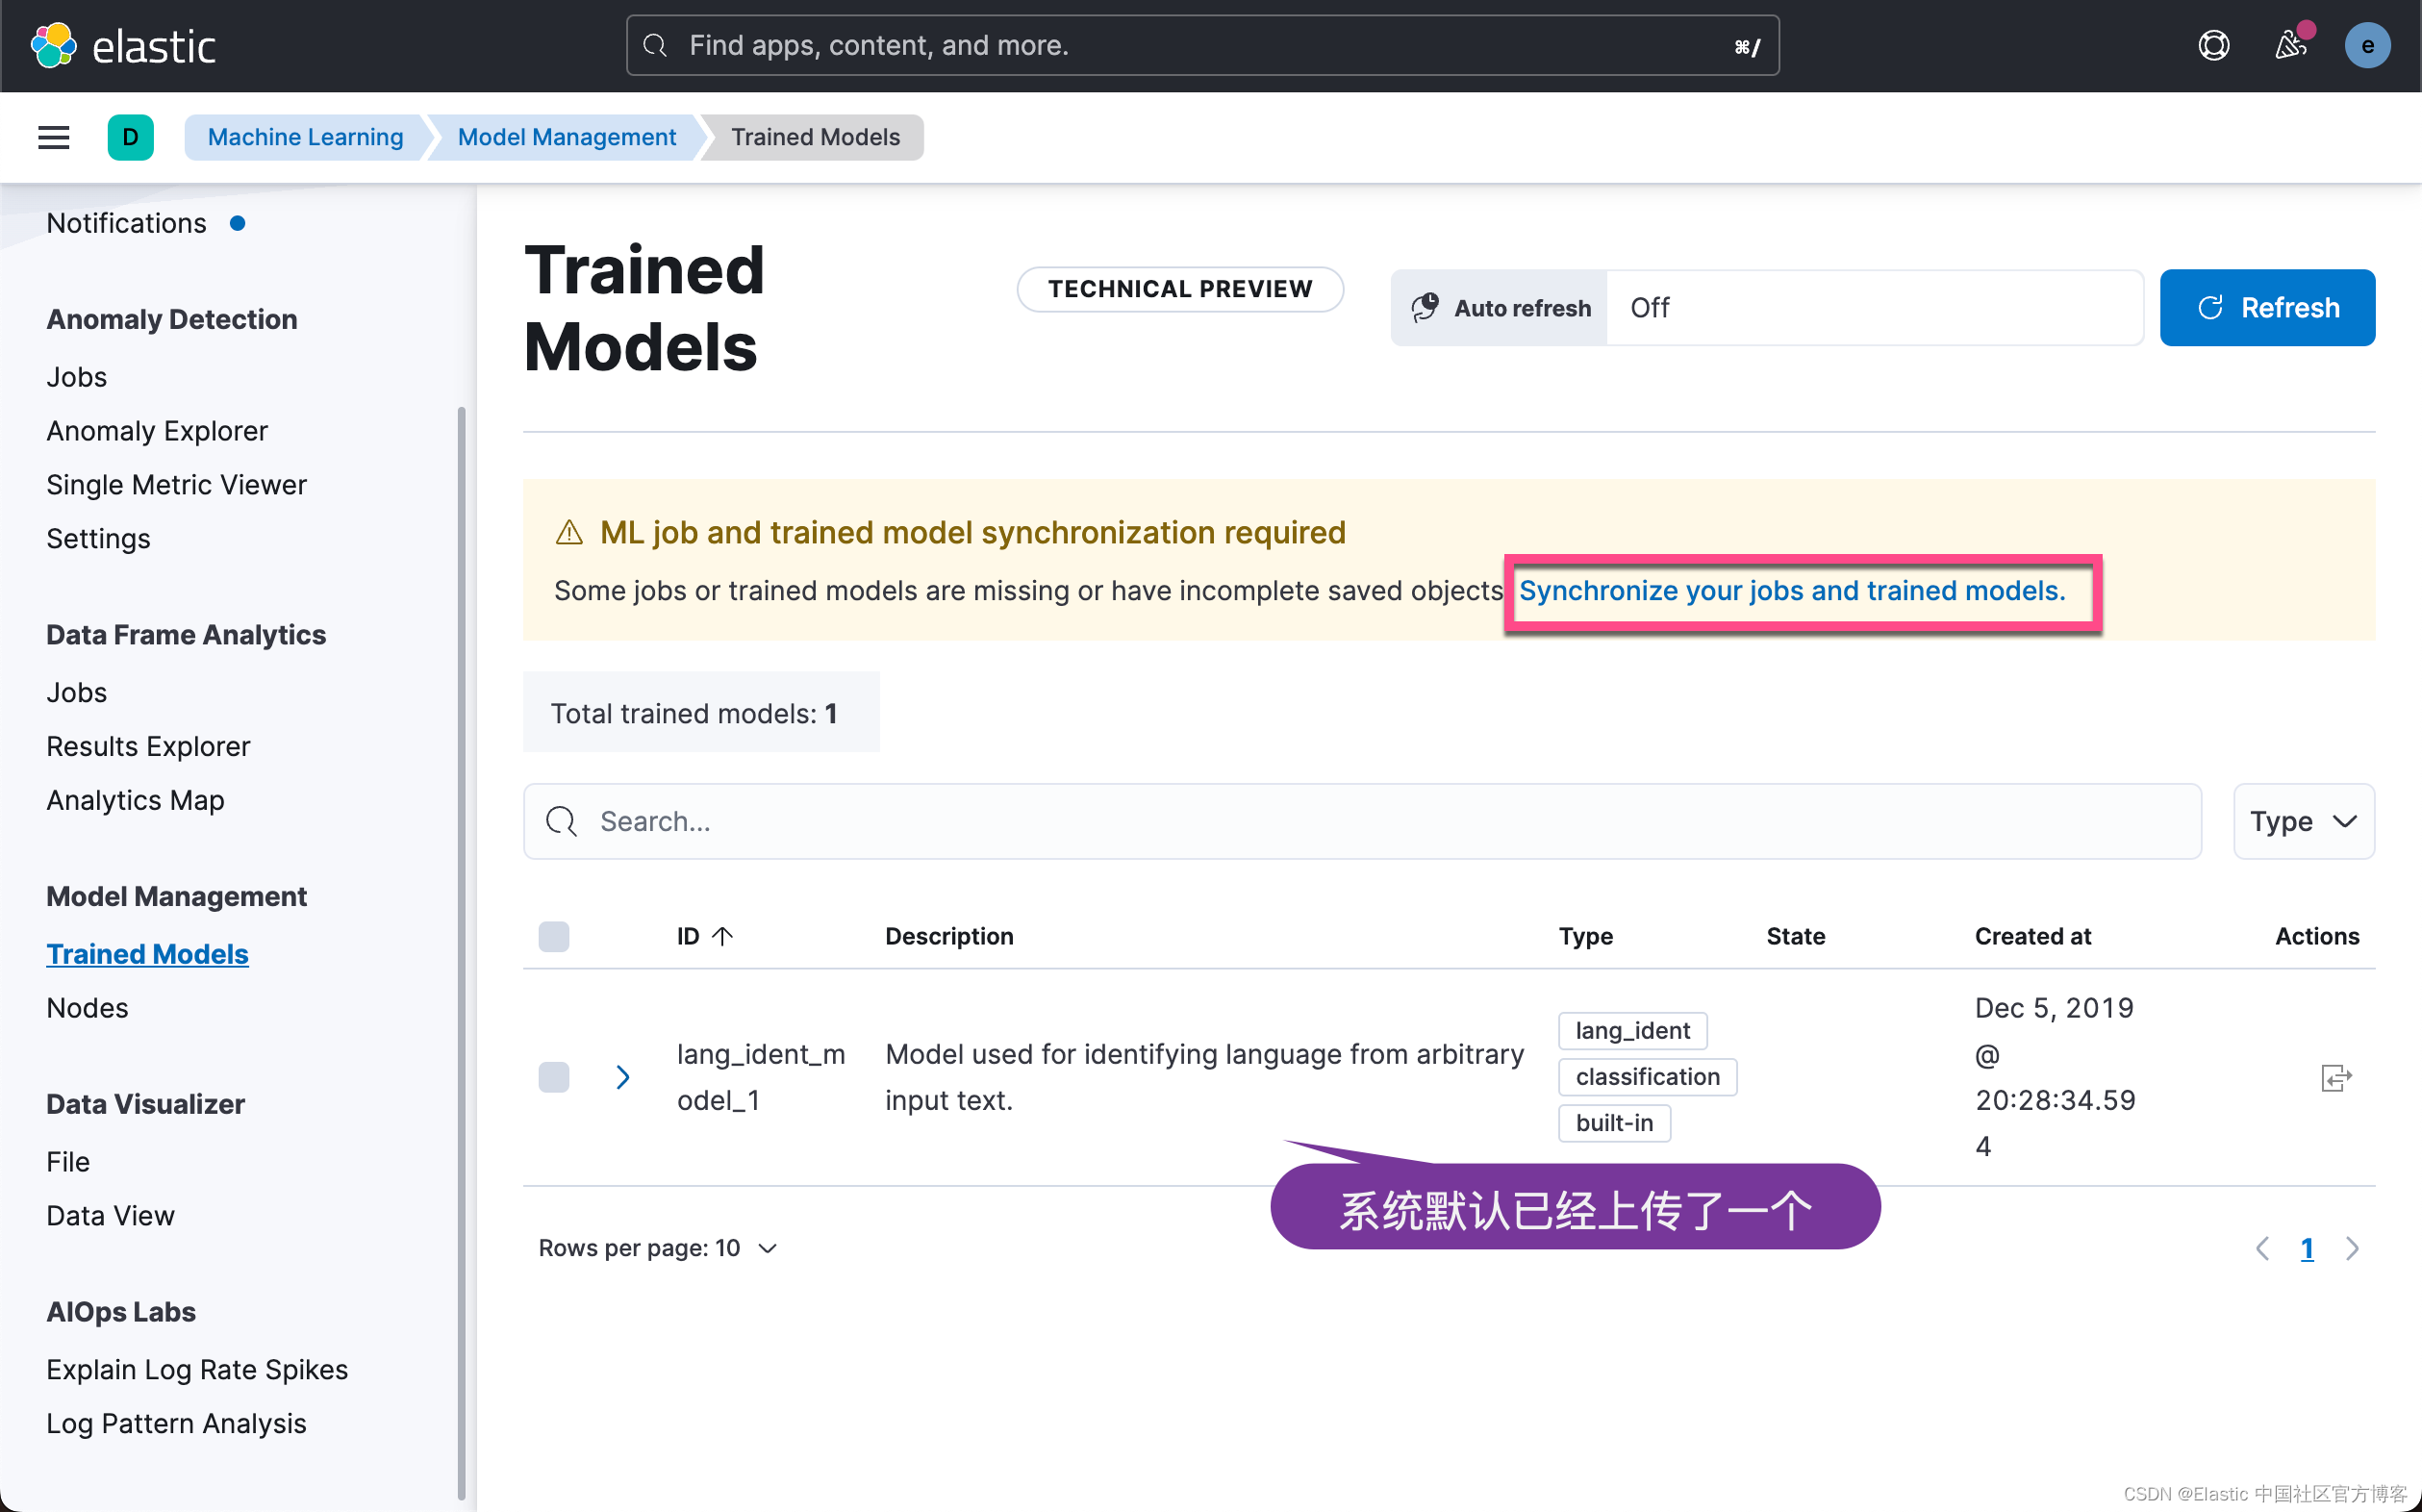
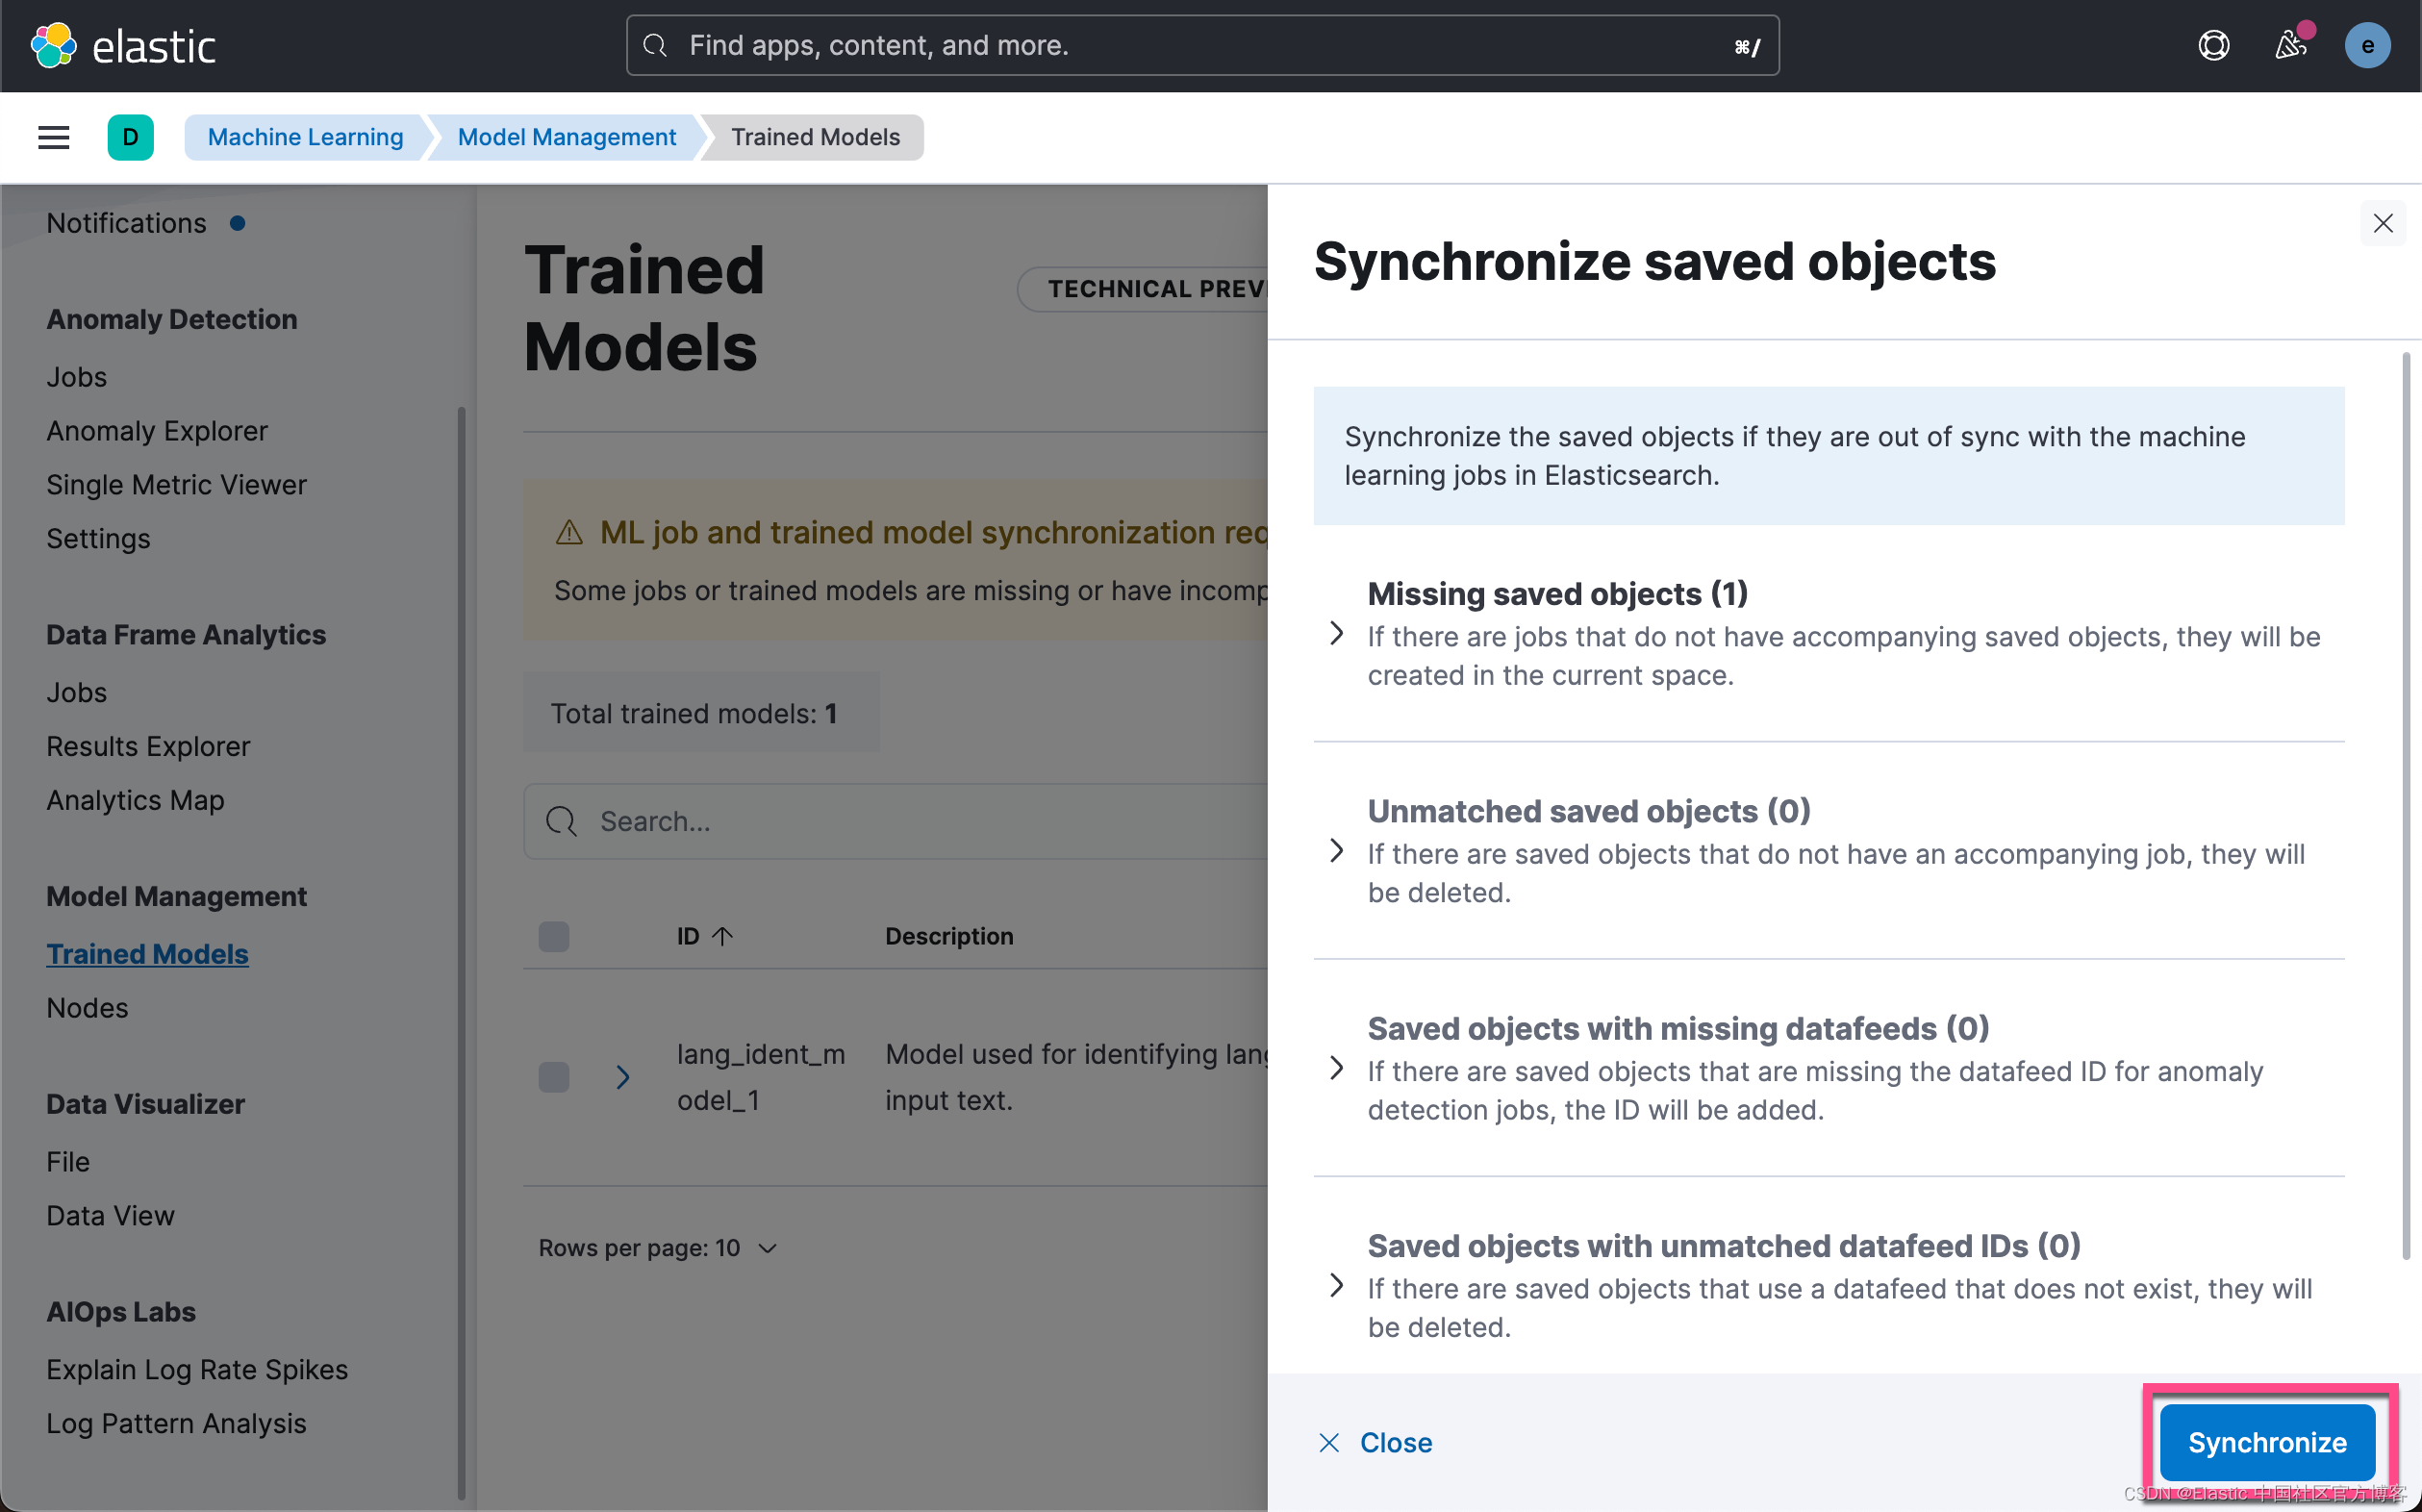
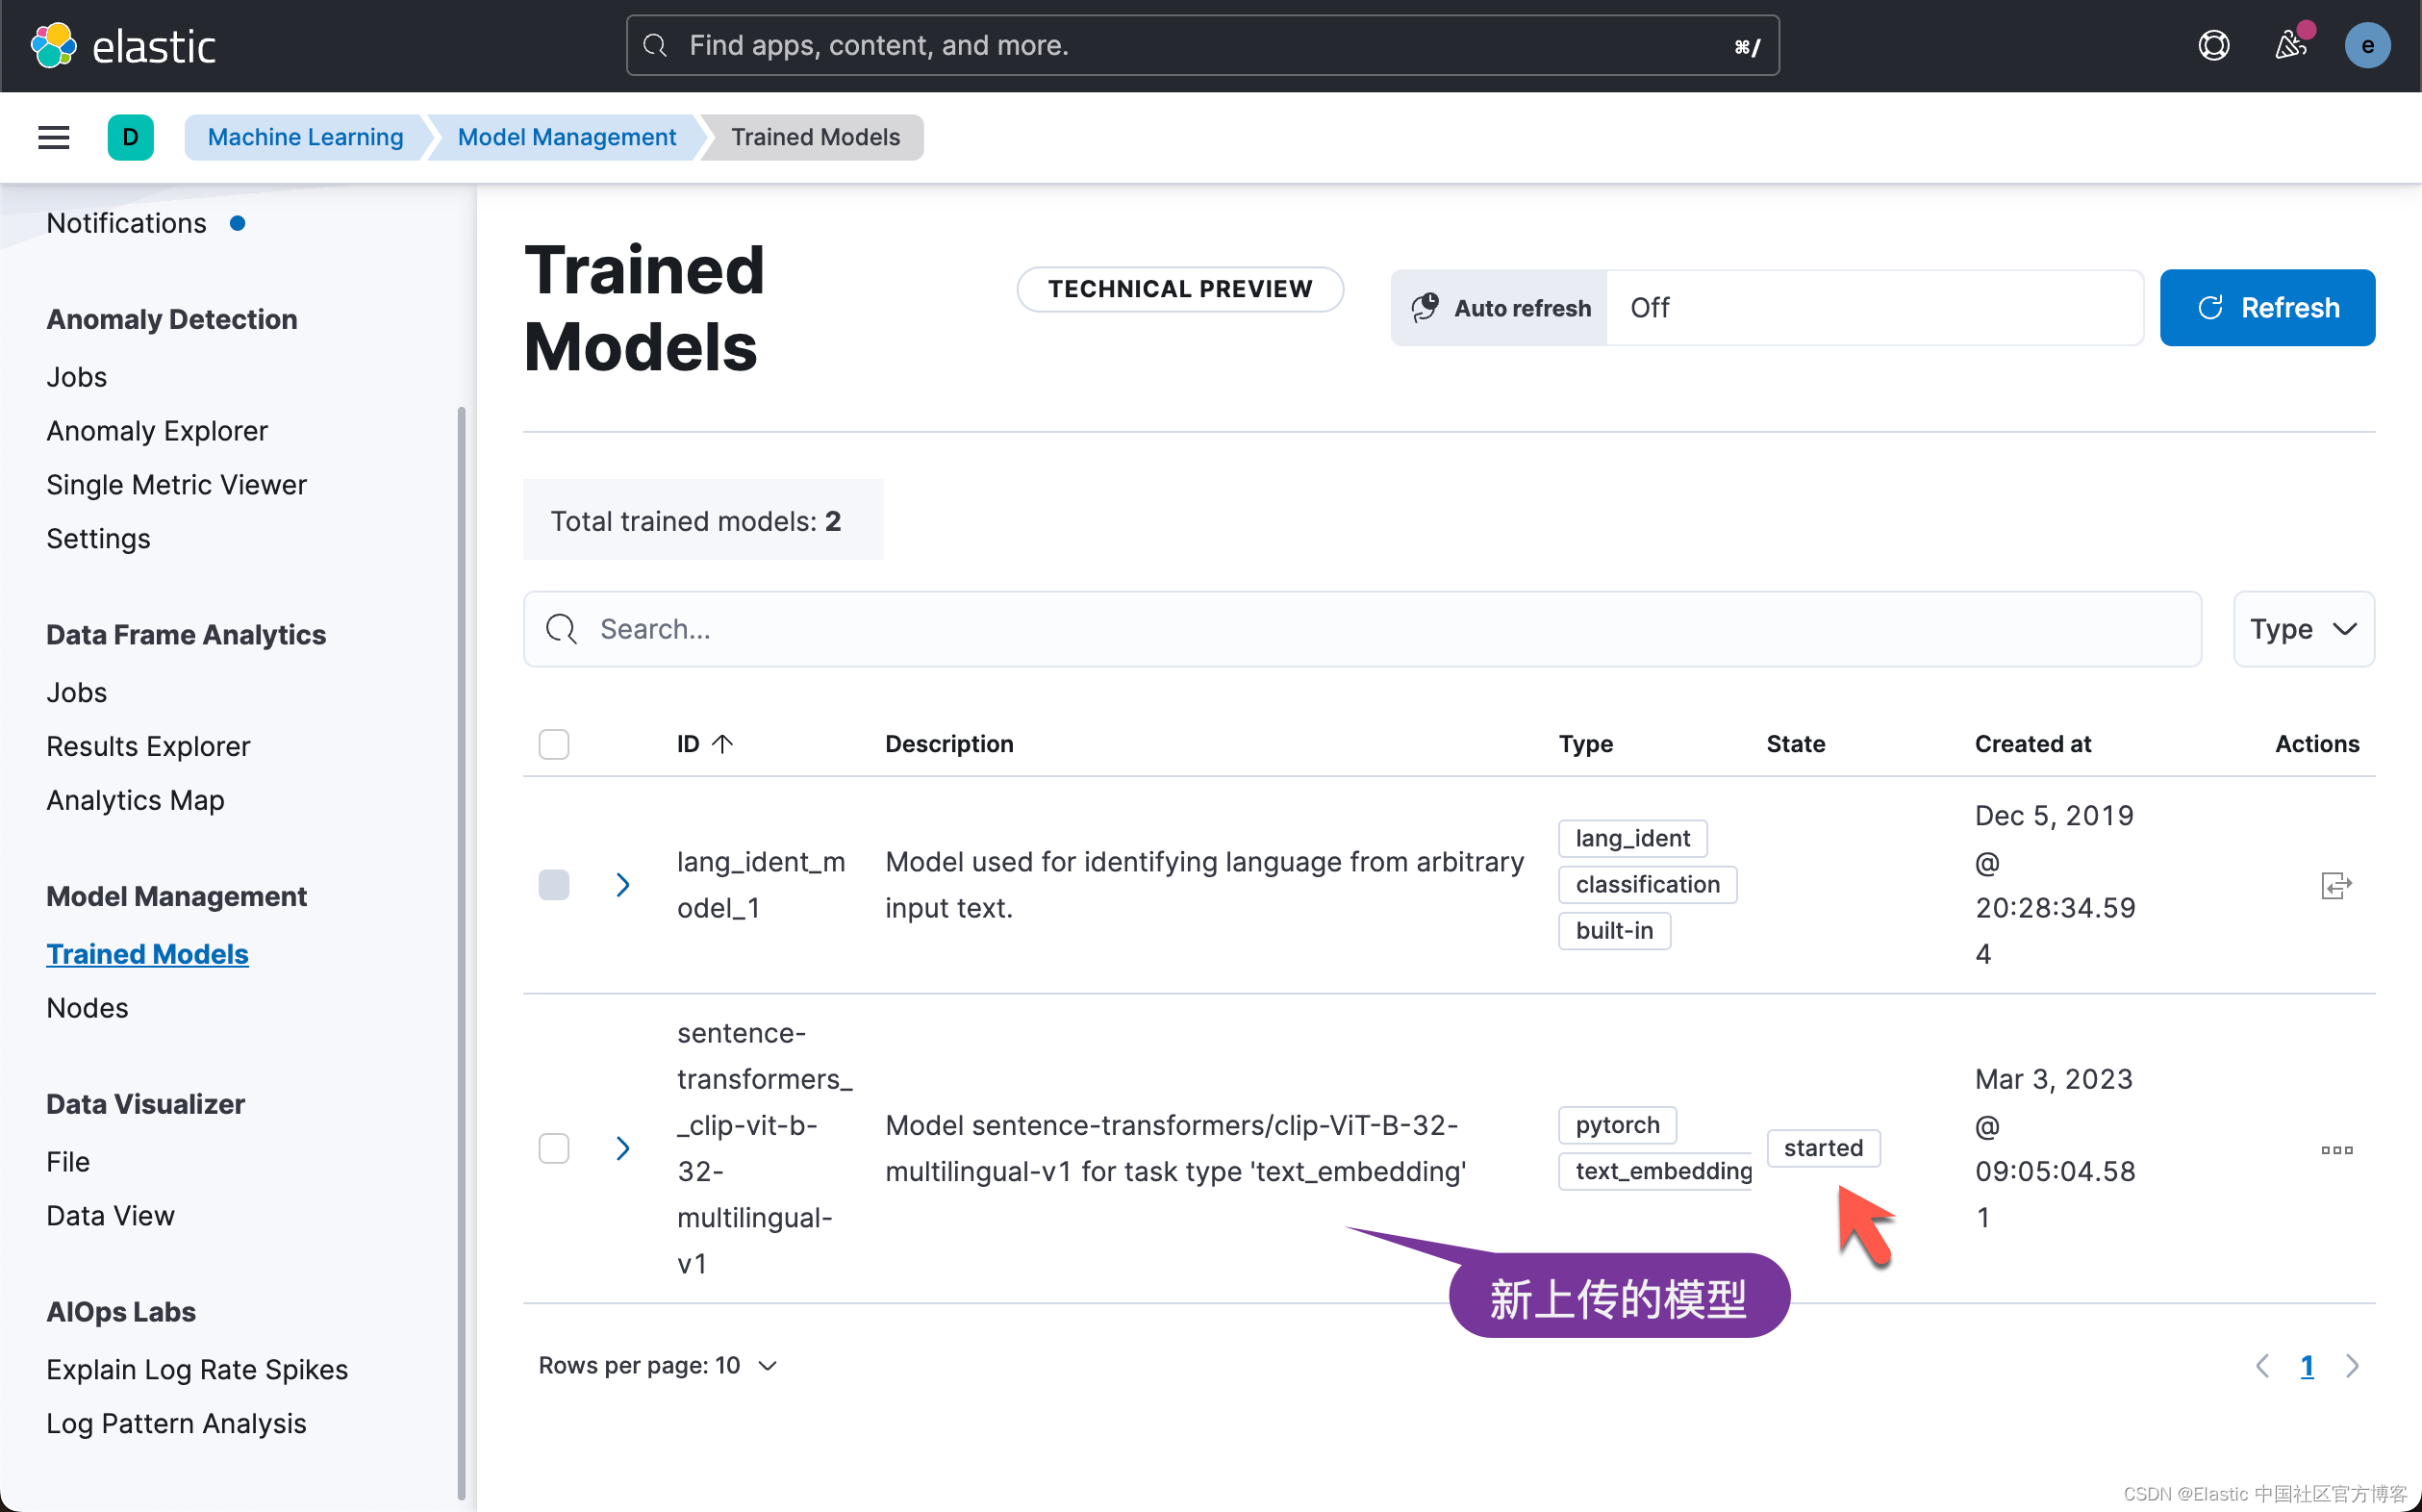
上面显示,我们已经成功地上传了模型。我们可以到 Kibana 中进行查看:
上面显示我们已经上传了所需要的 CLIP 模型,并且它的状态是 started。
如何创建图像嵌入
在设置 Elasticsearch 集群并导入嵌入模型后,你需要矢量化图像数据并为数据集中的每个图像创建图像嵌入。
要创建图像嵌入,请使用简单的 Python 脚本。 你可以在此处找到该脚本:create-image-embeddings.py。 该脚本将遍历你的图像目录并生成单独的图像嵌入。 它将使用名称和相对路径创建文档,并使用提供的映射将其保存到 Elasticsearch 索引 my-image-embeddings 中。
将所有图像(照片)放入文件夹 app/static/images。 使用带有子文件夹的目录结构来组织图像。 所有图像准备就绪后,使用几个参数执行脚本。
至少要有几百张图像才能获得合理的结果,这一点至关重要。 图像太少不会产生预期的结果,因为你要搜索的空间非常小,而且到搜索向量的距离也非常相似。我尝试在网上下载很多的照片,但是感觉一张一张地下载非常麻烦。你可以在谷歌浏览器中添加插件 Image downloader - Imageye。它可以方便地把很多照片一次下载下来。
在 image_embeddings 文件夹中,运行脚本并为变量使用你的值。
1.  cd image_embeddings
2.  python3 create-image-embeddings.py \
3.    --es_host='https://localhost:9200' \
4.    --es_user='elastic' --es_password='ZgzSt2vHNwA6yPn-fllr' \
5.    --ca_certs='/Users/liuxg/elastic/elasticsearch-8.6.1/config/certs/http_ca.crt'
根据图像的数量、它们的大小、你的 CPU 和你的网络连接,此任务将需要一些时间。 在尝试处理完整数据集之前,先试验少量图像。脚本完成后,你可以使用 Kibana 开发工具验证索引 my-image-embeddings 是否存在并具有相应的文档。
我们在Kibana 中进行查看:
GET _cat/indices/my-image-embeddings?v上面命令的响应为:
1.  health status index               uuid                   pri rep docs.count docs.deleted store.size pri.store.size
2.  yellow open   my-image-embeddings h6oUBdHCScWmXOZaf57oWg   1   1        145            0      1.4mb          1.4mb
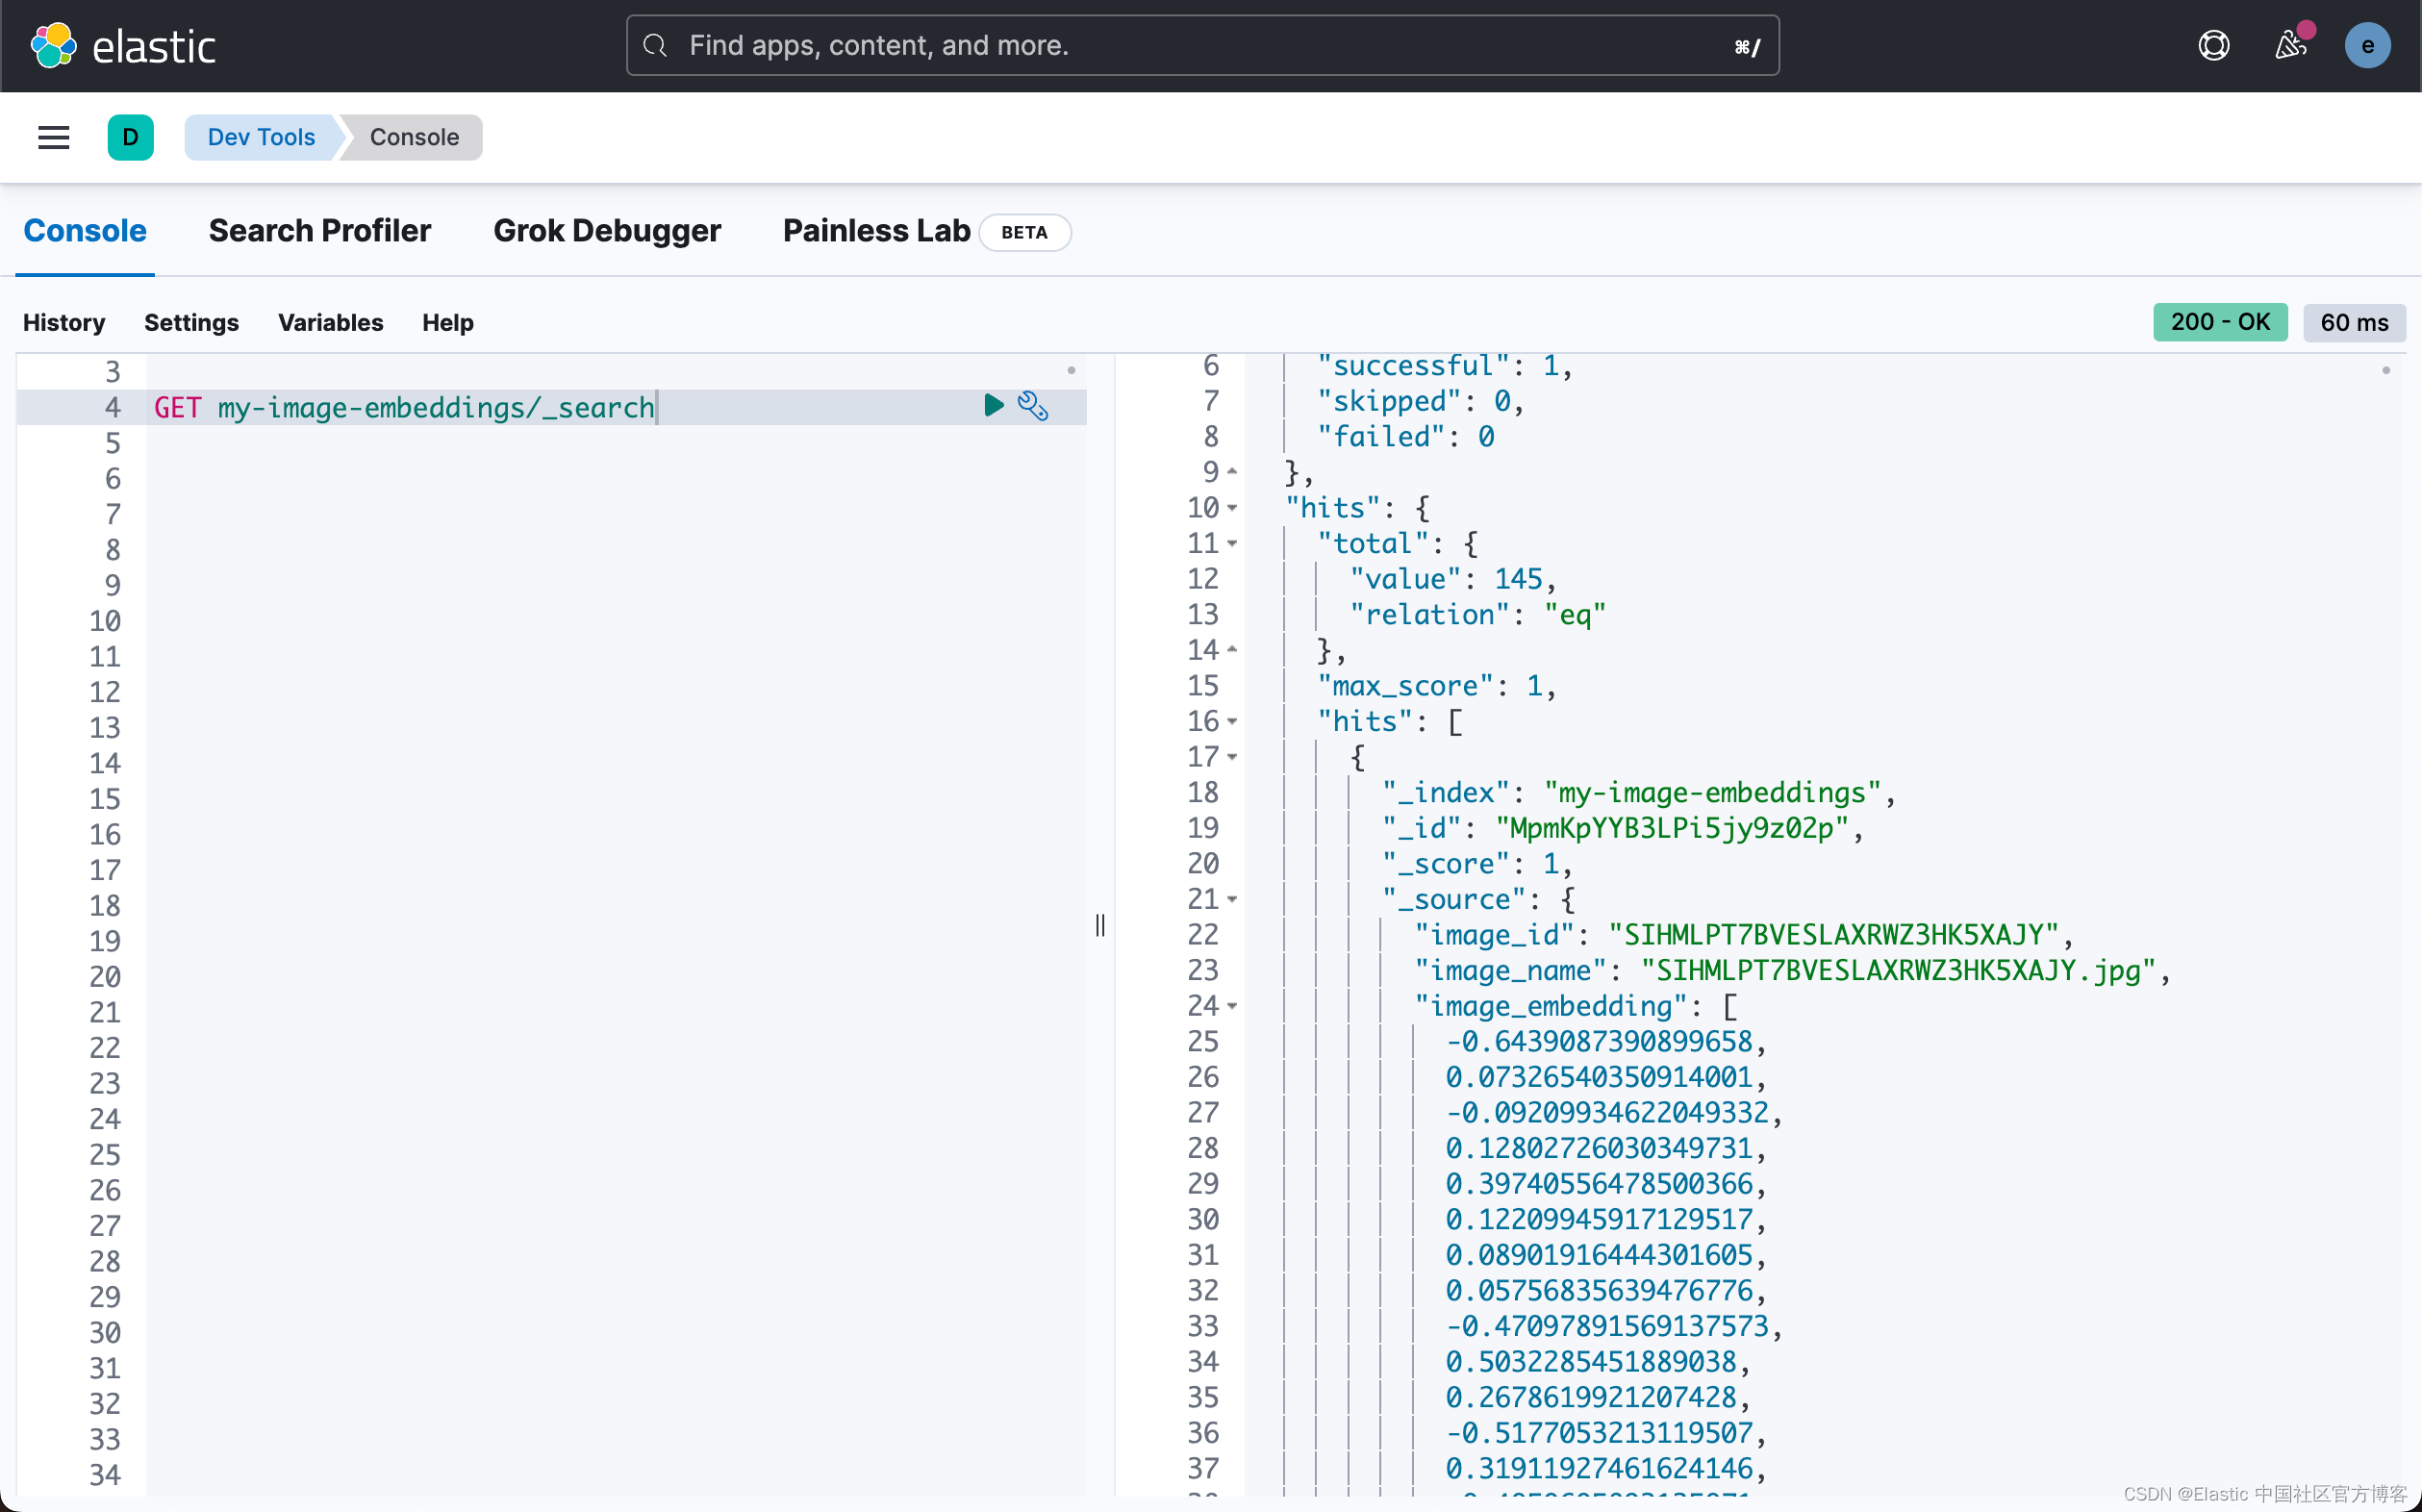
查看文档,你会看到非常相似的 JSON 对象(如示例)。 你将在图像文件夹中看到图像名称、图像 ID 和相对路径。 此路径用于前端应用程序以在搜索时正确显示图像。JSON 文档中最重要的部分是包含 CLIP 模型生成的密集矢量的 image_embedding。 当应用程序正在搜索图像或类似图像时使用此矢量。
GET my-image-embeddings/_search
1.  {
2.     "_index": "my-image-embeddings",
3.     "_id": "_g9ACIUBMEjlQge4tztV",
4.     "_score": 6.703597,
5.     "_source": {
6.       "image_id": "IMG_4032",
7.       "image_name": "IMG_4032.jpeg",
8.       "image_embedding": [
9.         -0.3415695130825043,
10.         0.1906963288784027,
11.         .....
12.         -0.10289803147315979,
13.         -0.15871885418891907
14.         ],
15.       "relative_path": "phone/IMG_4032.jpeg"
16.     }
17.  }
使用 Flask 应用程序搜索图像
现在你的环境已全部设置完毕,你可以进行下一步,使用我们作为概念证明提供的 Flask 应用程序,使用自然语言实际搜索图像并查找相似图像。 该 Web 应用程序具有简单的 UI,使图像搜索变得简单。 你可以在此 GitHub 存储库中访问原型 Flask 应用程序。
后台应用程序执行两个任务。 在搜索框中输入搜索字符串后,文本将使用机器学习 _infer 端点进行矢量化。 然后,针对带有向量的索引 my-image-embeddings 执行带有密集向量的查询。
你可以在示例中看到这两个查询。 第一个 API 调用使用 _infer 端点,结果是一个密集矢量。
1.  POST _ml/trained_models/sentence-transformers__clip-vit-b-32-multilingual-v1/_infer
2.  {
3.    "docs" : [
4.      {"text_field": "Yellow mountain is the most beautiful mountain in China"}
5.      ]
6.  }
上面的响应如下:
在第二个任务中,搜索查询,我们将使用密集矢量并获得按分数排序的图像。
`
1. GET my-image-embeddings/_search
2. {
3. "fields": [
4. "image_id",
5. "image_name",
6. "relative_path"
7. ],
8. "_source": false,
9. "knn": {
10. "field": "image_embedding",
11. "k": 5,
12. "num_candidates": 10,
13. "query_vector": [
14. 0.03395160660147667,
15. 0.007704082876443863,
16. 0.14996188879013062,
17. -0.10693030804395676,
18. ...
19. 0.05140634626150131,
20. 0.07114913314580917
21. ]
22. }
23. }
`
要启动并运行 Flask 应用程序,请导航到存储库的根文件夹并配置 .env 文件。 配置文件中的值用于连接到 Elasticsearch 集群。 你需要为以下变量插入值。 这些与图像嵌入生成中使用的值相同。
.env
1.  ES_HOST='URL:PORT'
2.  ES_USER='elastic'
3.  ES_PWD='password'
为了能够使得我们自构建的 Elasticsearch 集群能够被正确地访问,我们必须把 Elasticsearch 的根证书拷贝到 Flask 应用的相应目录中:
flask-elastic-image-search/app/conf/ca.crt
1.  (.venv) $ pwd
2.  /Users/liuxg/python/flask-elastic-image-search/app/conf
3.  (.venv) $ cp ~/elastic/elasticsearch-8.6.1/config/certs/http_ca.crt ca.crt
4.  overwrite ca.crt? (y/n [n]) y
在上面,我们替换了仓库中原有的证书文件 ca.crt。
准备就绪后,运行主文件夹中的 flask 应用程序并等待它启动。
1.  # In the main directory
2.  $ flask run --port=5001
如果应用程序启动,你将看到类似于下面的输出,它在末尾指示你需要访问哪个 URL 才能访问该应用程序。
恭喜! 你的应用程序现在应该已启动并正在运行,并且可以通过互联网浏览器在 http://127.0.0.1:5001 上访问。
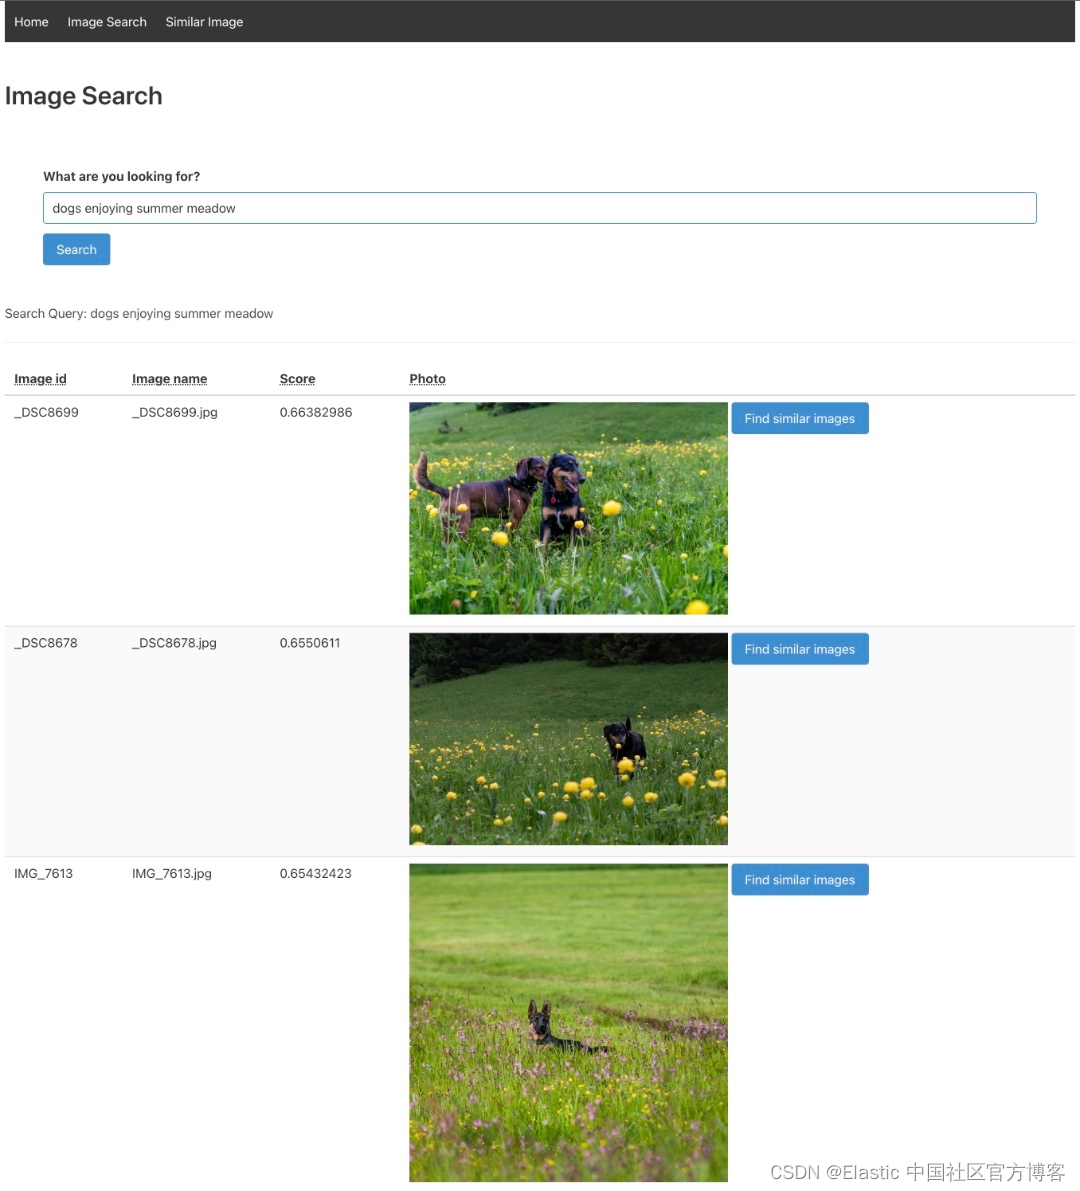
导航到图像搜索选项卡并输入描述你最佳图像的文本。 尝试使用非关键字或描述性文字。
在下面的示例中,输入的文本是 “Yellow mountain is the most beautiful mountain in China”。 结果显示在我们的数据集中。 如果用户喜欢结果集中的一张特定图像,只需单击它旁边的按钮,就会显示类似的图像。 用户可以无限次地这样做,并通过图像数据集构建自己的路径。
我们尝试另外的一个例子。这次我们输入:I love beautiful girls。
搜索也可以通过简单地上传图像来进行。 该应用程序会将图像转换为矢量并在数据集中搜索相似的图像。 为此,导航到第三个选项卡 “Similar Image”,从磁盘上传图像,然后点击 “Search”。
我们可以看到相似的图片。我们尝试使用一个女孩的照片再试试:
因为我们在 Elasticsearch 中使用的 NLP(sentence-transformers/clip-ViT-B-32-multilingual-v1)模型是多语言的,支持多语言推理,所以尽量搜索自己语言的图片。 然后也使用英文文本验证结果。我们尝试使用 “黄山是中国最漂亮的山”:
请务必注意,使用的模型是通用模型,这些模型非常准确,但你获得的结果会因用例或其他因素而异。 如果你需要更高的精度,则必须采用通用模型或开发自己的模型 —— CLIP 模型只是一个起点。
代码摘要
你可以在 GitHub 存储库中找到完整的代码。 你可能正在检查 routes.py 中的代码,它实现了应用程序的主要逻辑。 除了明显的路线定义之外,你还应该关注定义 _infer 和 _search 端点(infer_trained_model 和 knn_search_images)的方法。 生成图像嵌入的代码位于 create-image-embeddings.py文件中。
总结
现在你已经设置了 Flask 应用程序,你可以轻松地搜索你自己的图像集! Elastic 在平台内提供了矢量搜索的原生集成,避免了与外部进程的通信。 你可以灵活地开发和使用你可能使用 PyTorch 开发的自定义嵌入模型。
语义图像搜索具有其他传统图像搜索方法的以下优点:
- 更高的准确度:向量相似性捕获上下文和关联,而不依赖于图像的文本元描述。
- 增强的用户体验:与猜测哪些关键字可能相关相比,描述你正在寻找的内容或提供示例图像。
- 图像数据库的分类:不用担心对图像进行分类——相似性搜索可以在一堆图像中找到相关图像,而无需对它们进行组织。
如果你的用例更多地依赖于文本数据,你可以在以前的博客中了解更多关于实现语义搜索和将自然语言处理应用于文本的信息。 对于文本数据,向量相似度与传统关键词评分的结合呈现了两全其美的效果。
准备好开始了吗? 在我们的虚拟活动中心报名参加矢量搜索实践研讨会,并在我们的在线论坛中与社区互动。
收起阅读 »社区日报 第1621期 (2023-04-28)
1.Elasticsearch Top50面试题(2023更新版本)
https://logit.io/blog/post/elk ... ions/
2.好玩:整合Elasticsearch+chatgpt案例
https://github.com/hunkim/es-gpt
3.Elasticsearch 8 docker 本地部署
https://levelup.gitconnected.c ... ff829
编辑:铭毅天下
归档:https://ela.st/cn-daily-all
订阅:https://ela.st/cn-daily-sub
沙龙:https://ela.st/cn-meetup
B站: https://ela.st/bilibili
1.Elasticsearch Top50面试题(2023更新版本)
https://logit.io/blog/post/elk ... ions/
2.好玩:整合Elasticsearch+chatgpt案例
https://github.com/hunkim/es-gpt
3.Elasticsearch 8 docker 本地部署
https://levelup.gitconnected.c ... ff829
编辑:铭毅天下
归档:https://ela.st/cn-daily-all
订阅:https://ela.st/cn-daily-sub
沙龙:https://ela.st/cn-meetup
B站: https://ela.st/bilibili 收起阅读 »
社区日报 第1620期 (2023-04-27)
https://dev.to/lisahjung/begin ... -5347
2.高级调优:查找和修复 Elasticsearch 慢查询
https://www.elastic.co/blog/ad ... eries
3.腾讯云大数据 Elasticsearch 在日志领域的系统性优化
https://cloud.tencent.com/deve ... 71480
编辑:Se7en
归档:https://ela.st/cn-daily-all
订阅:https://ela.st/cn-daily-sub
沙龙:https://ela.st/cn-meetup
B站: https://ela.st/bilibili
https://dev.to/lisahjung/begin ... -5347
2.高级调优:查找和修复 Elasticsearch 慢查询
https://www.elastic.co/blog/ad ... eries
3.腾讯云大数据 Elasticsearch 在日志领域的系统性优化
https://cloud.tencent.com/deve ... 71480
编辑:Se7en
归档:https://ela.st/cn-daily-all
订阅:https://ela.st/cn-daily-sub
沙龙:https://ela.st/cn-meetup
B站: https://ela.st/bilibili 收起阅读 »
社区日报 第1619期 (2023-04-26)
https://blog.csdn.net/UbuntuTo ... 34582
2.Elasticsearch:了解和解决文档更新后 Elasticsearch 分数的变化
https://blog.csdn.net/UbuntuTo ... 13637
3.ChatGPT 和 Elasticsearch:OpenAI 遇见私有数据
https://blog.csdn.net/UbuntuTo ... 79557
编辑:kin122
归档:https://ela.st/cn-daily-all
订阅:https://ela.st/cn-daily-sub
沙龙:https://ela.st/cn-meetup
B站:https://ela.st/bilibili
https://blog.csdn.net/UbuntuTo ... 34582
2.Elasticsearch:了解和解决文档更新后 Elasticsearch 分数的变化
https://blog.csdn.net/UbuntuTo ... 13637
3.ChatGPT 和 Elasticsearch:OpenAI 遇见私有数据
https://blog.csdn.net/UbuntuTo ... 79557
编辑:kin122
归档:https://ela.st/cn-daily-all
订阅:https://ela.st/cn-daily-sub
沙龙:https://ela.st/cn-meetup
B站:https://ela.st/bilibili 收起阅读 »
社区日报 第1618期 (2023-04-25)
OpenShift搭建Elasticsearch完全手册(需要梯子)
1. https://medium.com/%40vaibhavv ... 93598
ES 基础概念简介(需要梯子)
2. https://medium.com/%40marateek ... 7d276
用elastic全家构建安全审计仪表盘(需要梯子)
3. https://medium.com/%40samiul00 ... 029ac
编辑:斯蒂文
归档:https://ela.st/cn-daily-all
订阅:https://ela.st/cn-daily-sub
沙龙:https://ela.st/cn-meetup
B站:https://ela.st/bilibili
收起阅读 »
社区日报 第1617期 (2023-04-24)
https://blog.csdn.net/laoyang3 ... 12946
2. kibana权限配置
https://help.aliyun.com/docume ... .html
3. Elasticsearch:如何部署 NLP:命名实体识别 (NER) 示例
https://blog.csdn.net/UbuntuTo ... 77711
编辑:yuebancanghai
归档:https://ela.st/cn-daily-all
订阅:https://ela.st/cn-daily-sub
沙龙:https://ela.st/cn-meetup
B站:https://ela.st/bilibili
https://blog.csdn.net/laoyang3 ... 12946
2. kibana权限配置
https://help.aliyun.com/docume ... .html
3. Elasticsearch:如何部署 NLP:命名实体识别 (NER) 示例
https://blog.csdn.net/UbuntuTo ... 77711
编辑:yuebancanghai
归档:https://ela.st/cn-daily-all
订阅:https://ela.st/cn-daily-sub
沙龙:https://ela.st/cn-meetup
B站:https://ela.st/bilibili 收起阅读 »


